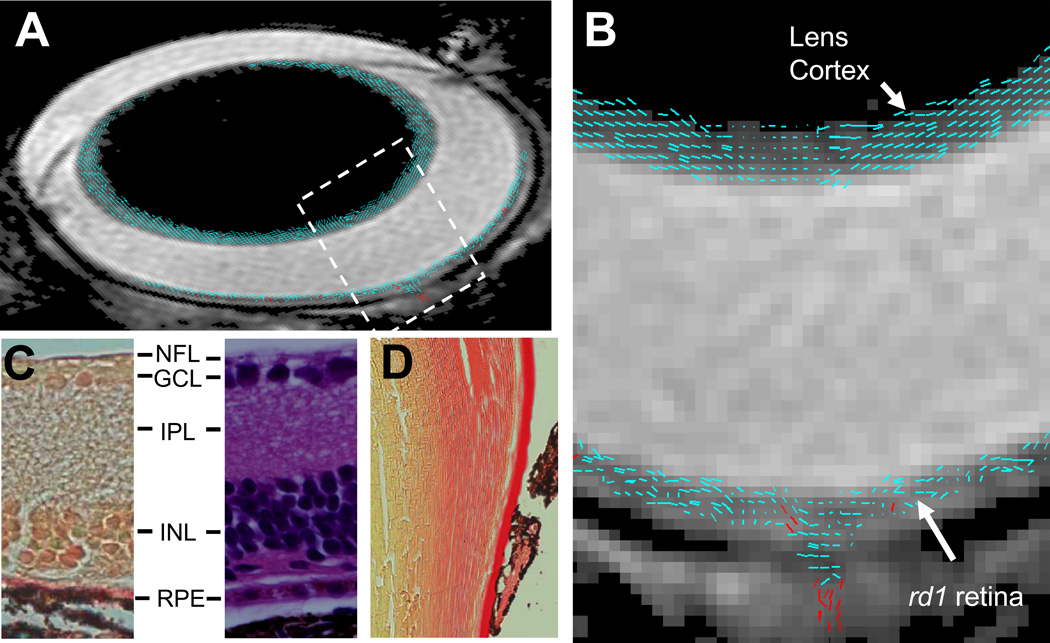
Figure 3.
A composite (A) and the expanded bird’s-eye view (B) images show DTI revealed cell alignment in an rd1 mouse eye. Cell alignments were color coded to differentiate cells aligned more parallel to (≤ 45°, blue) or perpendicular to (> 45°, red) the retina or lens surface. A picrocirous red (C, left) and an H&E (C, right) stained retina sections of an rd1 mouse show the lack of photoreceptor cells. A picrocirous red stained lens section of the rd1 mouse shows fiber cells in the lens cortex are aligned parallel to the lens surface (D). RPE, retinal pigment epithelium.

