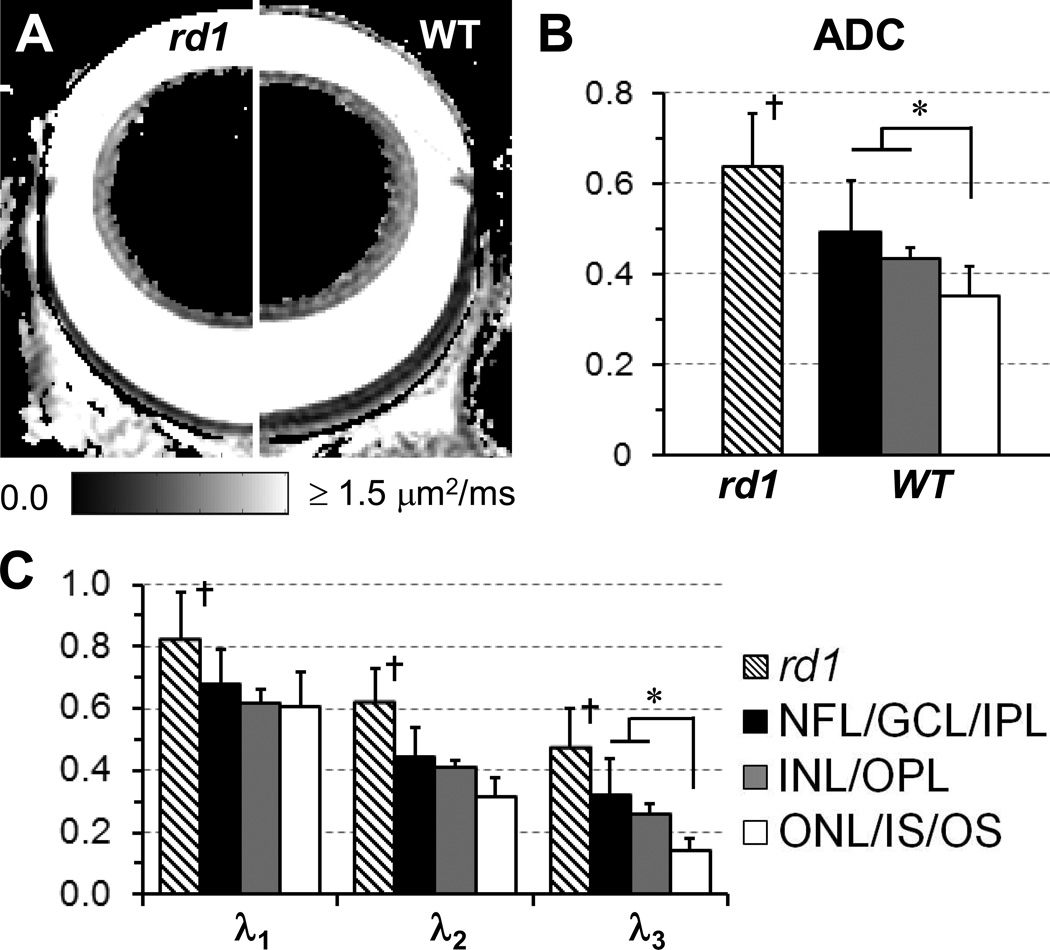
Figure 4.
DTI determined ADC maps of the eyes of an rd1 (left side) and a WT (right side) mice (A). ADC (B) and λ1–3 (C) of the MR-detected retina layers in rd1 and WT mice were quantified. The unit of ADC and λ1–3 is µm2/ms. *, p < 0.05; †, p <0.05 compared to MR-detected middle and outer layers of WT mice.

