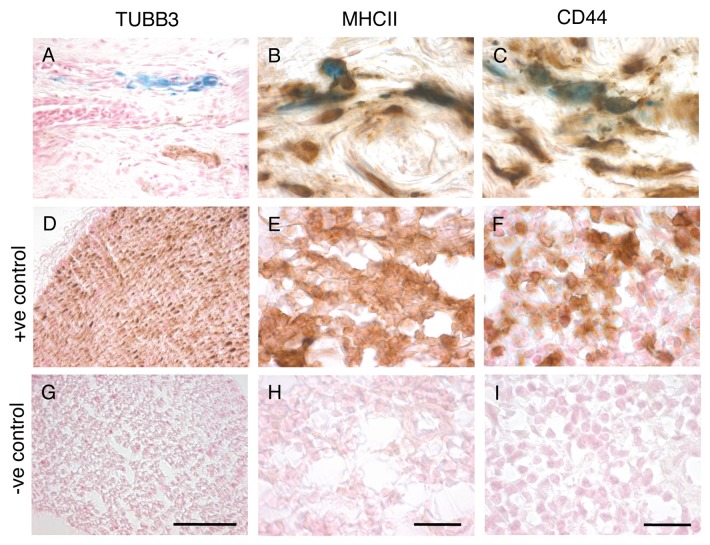
Figure 3. Immunohistochemistry on Austrian Cohort. (A–C) Representative images of sections stained with PB and sera against (A) TUBB3, (B) MHCII or (C) CD44. Quantitative analysis revealed just 0.23% of PB-positive cells co-localize with TUBB3 (n = 4 birds, 992 cells). In contrast, 97.2% of PB positive cells co-localized with MHCII (n = 7 birds, 253 cells) and 93.9% with CD44 (n = 8 birds, 382 cells). (D–F) Positive controls for immunostaining. (D) Shows the ophthalmic branch of the trigeminal, a positive controls for TUBB3 staining. (E–F) Shows spleen sections, which served as positive controls for MHCII (E) and CD44 (F) staining. (G–I) Negative controls (the primary antibody was absent) for TUBB3, MHCII and CD44 experiments shows no background staining. Scale bars for MHCII and CD44 staining shown in H and I indicate 10 µm. Scale bar for TUBB3 staining shown in G indicates 50 µm.

An official website of the United States government
Here's how you know
Official websites use .gov
A
.gov website belongs to an official
government organization in the United States.
Secure .gov websites use HTTPS
A lock (
) or https:// means you've safely
connected to the .gov website. Share sensitive
information only on official, secure websites.
