
Figure 3.
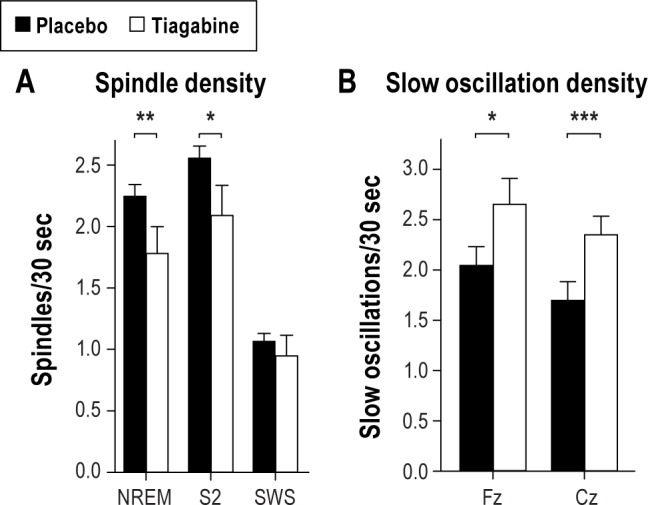
(A) Mean (± SEM) density of (fast) spindles during entire NREM sleep, and separately for sleep stage 2 and SWS, and (B) slow oscillation density during NREM sleep, separately for recordings from Fz and Cz, in the tiagabine (empty bars) and placebo condition (black bars). ***P ≤ 0.001, **P ≤ 0.01, and *P ≤ 0.05 for pairwise comparisons between the effects of the treatment (n = 10).