
Figure 1.
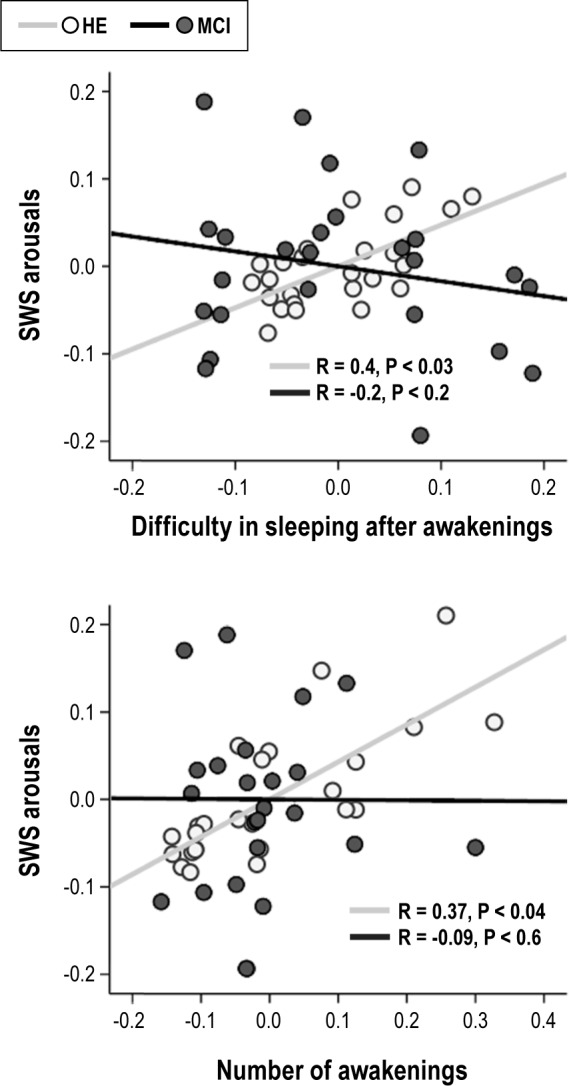
Scatter plots displaying relationships between density of slow wave sleep (SWS) arousals and either self-reported difficulty in sleeping after awakenings (top panel) or number of awakenings (bottom panel) after controlling for the effects of age and sex. Note that only HE subjects showed significant relationships between objective and subjective sleep.