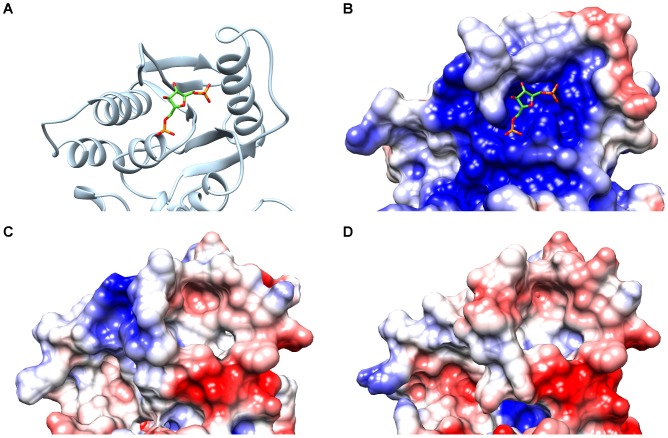
Figure 3. Electrostatic potentials at the allosteric sites of PYKs.
The electrostatic potential is mapped on the molecular surface of each enzyme. Negative potentials are displayed in red, positive potentials in blue on a scale from −2 to +2 kT/e. Panel A shows a section of the crystallographically resolved Saccharomyces cerevisiae PYK (PDB id: 1A3W, chain A) in cartoon representation with the activator FBP bound in the allosteric site in stick representation. The electrostatic potentials displayed in panels B to D correspond to the same regions of the structure as shown in panel A. Panel B represents the electrostatic potential computed for the Saccharomyces cerevisiae PYK, panels C and D show the electrostatic potentials computed for the models of PYKs from Streptococcus pyogenes and Lactobacillus plantarum, respectively. The Saccharomyces cerevisiae PYK displays a broad region of positive potential at the allosteric binding site, whereas in the LAB PYKs, a rather negative potential is observed in parts of the allosteric binding site and in its proximity (panels C and D). These negatively charged regions may hinder electrostatic steering of allosteric activators to the allosteric site.

