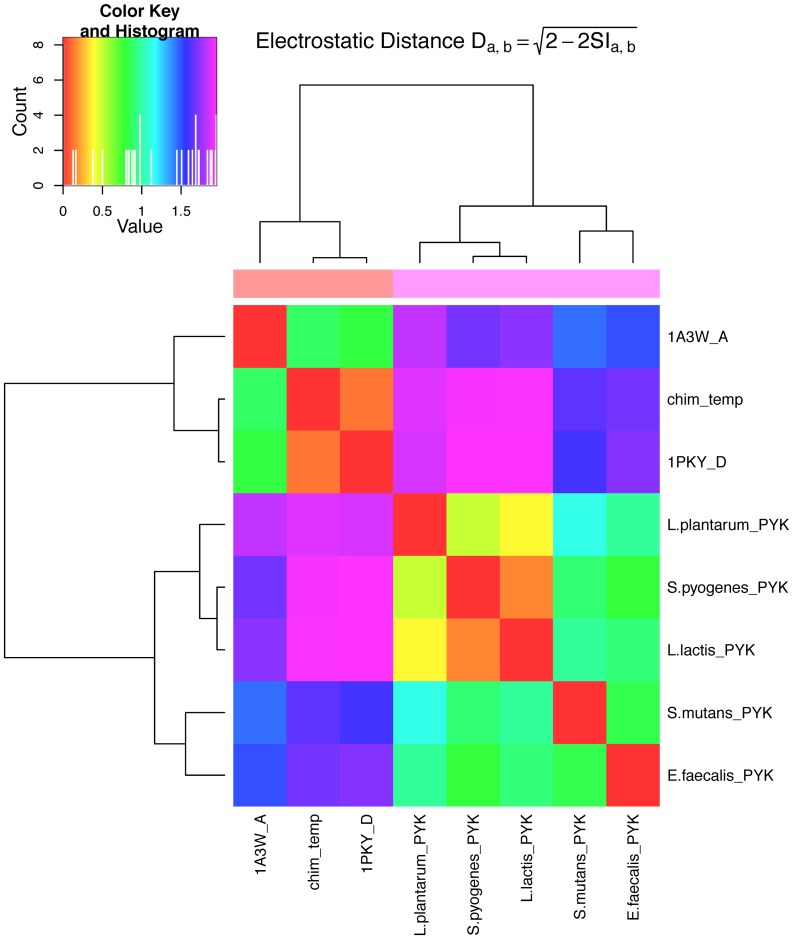
Figure 4. Quantitative comparison of the electrostatic potentials at the allosteric sites of PYKs.
Identical and highly similar electrostatic potentials are indicated by red and orange colours. Light blue fields indicate no correlation. Anti-correlation of the electrostatic potentials is represented in pink, as shown in the colour key. Two clusters of different electrostatic potentials are observed. One includes the LAB, indicating almost identical electrostatic potentials in the allosteric sites of the PYKs from Lactococcus lactis (L.lactis_PYK) and Streptococcus pyogenes (S.pyogenes_PYK). Both also show high correlation to the allosteric site of the PYK from Lactobacillus plantarum (L.plantarum_PYK). Little correlation is observed to the other LAB. The second cluster is formed by the electrostatic potentials computed for the template (chim_temp) and the reference crystal structures (1PKY, 1A3W). As expected, almost identical electrostatic potentials are observed for the allosteric site of the chimeric template and the crystal structure 1PKY. The computed similarity indices are shown in Table S2.

