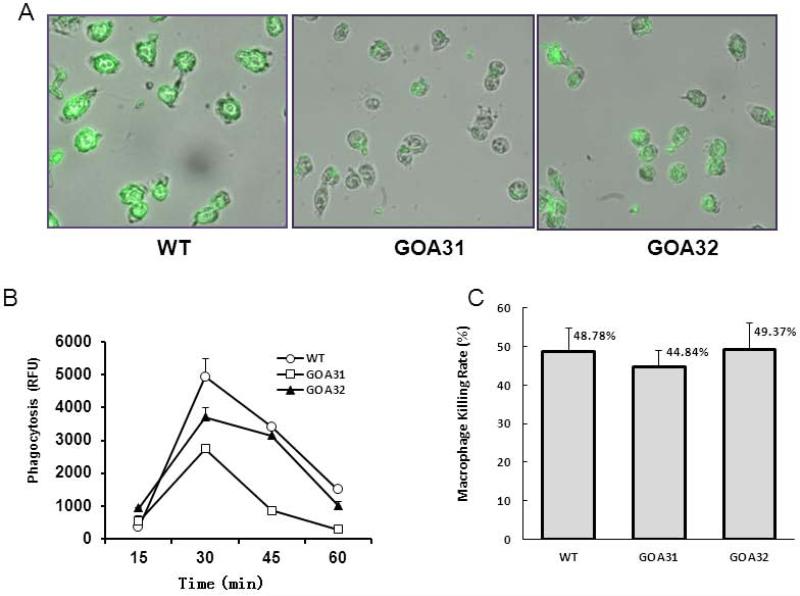
Figure 2.
Phagocytosis of all strains is shown following incubation with macrophages (RAW264.7) for the times indicated. All strains were pre-labeled with FITC. Fluorescence by un-labeled yeast cells was quenched with trypan blue prior to measuring the fluorescence of ingested yeasts. (A) Images are displayed from cells following an incubation of 30 min; (B) The fluorescence of internalized yeast was followed for 1 h at 15 min intervals by spectrofluorimetrics (Ex/Em=495/525). A reduction in the phagocytosis of goa1Δ (GOA31) compared to WT and GOA32 was noted at 30 min (P< 0.01). (C) Viability of all strains is shown after an overnight incubation with macrophages (RAW264.7). Viable colonies of each strain were counted under microscopy. Data are averages of two separate experiments. A Student's unpaired t test was used to determine P values, P> 0.05.

