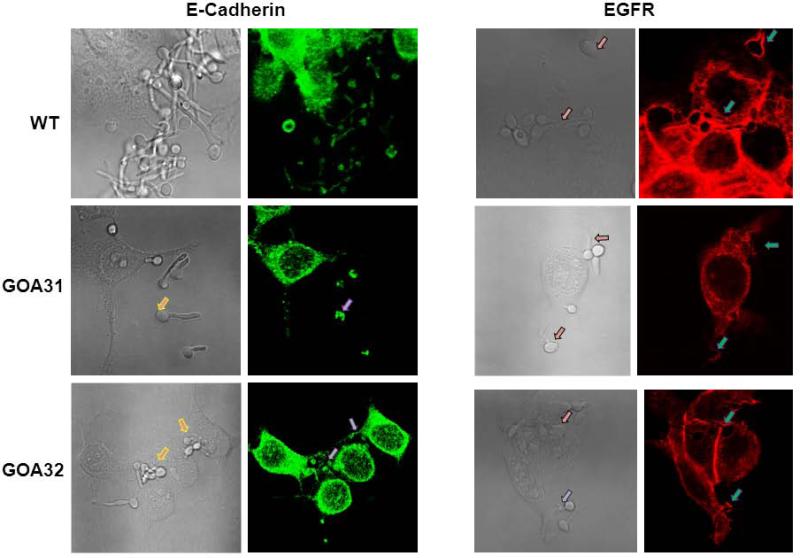
Figure 4.
Confocal microscopic images of the FaDu epithelial cell line E-Cadherin and EGFR. Yeast cells were incubated with FaDu cells for 90 min in MEM Earl's salts plus 10% FBS, then stained with either the anti-ECadherin antibody conjugated with Alexa 488 (left panel) or anti-EGFR antibody conjugated with Alexa 555 (right panel). Images (left panel of each stain) are compared to bright-field images (right panel). The goa1Δ null was poorly or partially stained with both antibodies compared to control strains. The arrows indicate the accumulation of fluorescent stain around the hyphae of control strains but not the goa1Δ (GOA31).

