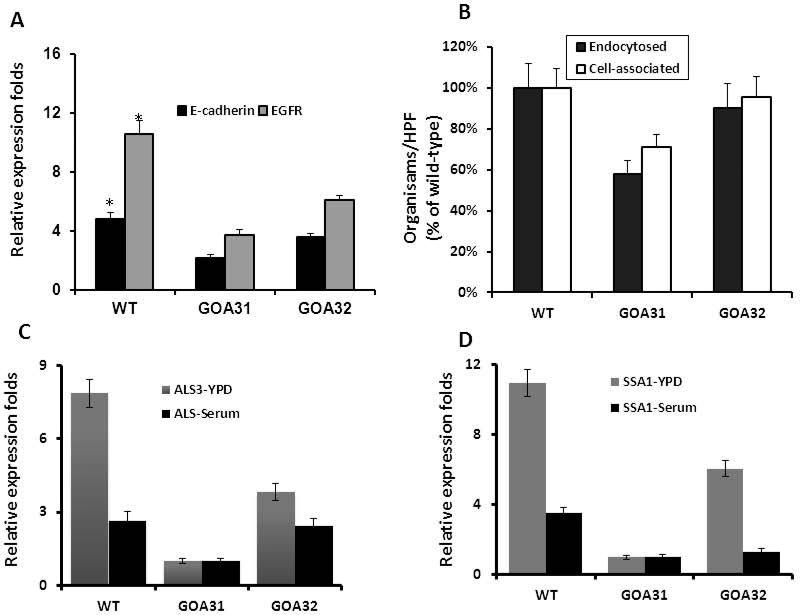
Figure 5.
(A) Expression levels of E-Cadherin and EGFR in FaDu epithelial cells are shown by real-time PCR after infection with each strain post-1h. The endocytosis and cell associated strains are shown after an incubation of 3 h. (B) Data are presented for each strain as the percentage of endocytosed or cell-associated cells per 200 epithelial cells. The expression of the Candida albicans cell adhesins ALS3 (C) and SSA1 (D) was significantly lower than control strains in both YPD and serum broth.

