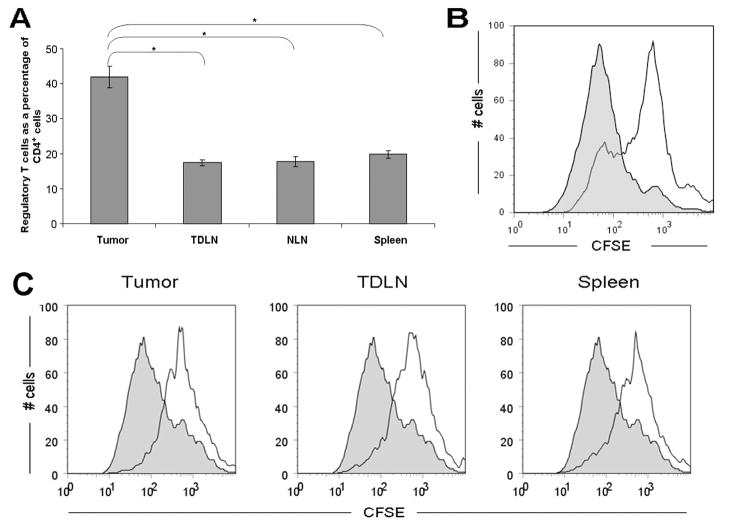
Figure 3. High levels of functional regulatory T cells infiltrate murine pancreatic adenocarcinoma.
(A) Prevalence of Treg in various compartments (tumor, tumor-draining lymph nodes, non-draining lymph nodes and spleen) in the tumor-bearing mouse at 4 weeks post tumor implantation. Compared to other compartments, there were higher numbers of Treg found in the tumor. Histogram shows percentage of CD4+ cells that are Foxp3+. Results represent mean ± SEM, * P < 0.005, from 5 independent experiments, each comprising 2–4 mice. (B) Tumor-derived Foxp3+ cells are suppressive in vivo. To examine the suppressive capacity of tumor-infiltrating Treg in Foxp3gfp mice, CD4+ cells were isolated from tumors 4–5 weeks after inoculation with Pan02, then sorted to collect the Foxp3+ Treg subset. CFSE-labeled thy1.1+ CD4+ CD25− T effector cells were subsequently co-cultured for 72 hours either alone (filled histogram) or with the sorted thy1.2+CD4+Foxp3+ cells in a 1:1 ratio (open histogram). For flow cytometric analysis, CFSE dilution was evaluated in thy1.1+ cells. Figure is representative of 2 independent experiments, each comprising 4–5 mice. (C) Tumor-derived CD4+CD25+ cells have equivalent suppressive ability to CD4+CD25+ cells from lymph nodes and spleen. To examine the suppressive capacity of tumor-infiltrating Treg, CD4+CD25+ cells were isolated from the spleen, tumor-draining lymph nodes and tumor of C57BL/6 (thy1.2+) mice 5 weeks after inoculation with Pan02. CFSE-labeled thy1.1+CD4+ CD25− T effector cells were subsequently co-cultured for 72 hours either alone (filled histograms) or with CD4+CD25+ cells (at a 1:1 ratio) derived from tumor; tumor-draining lymph nodes; or spleen (open histograms). Figure is representative of 2 independent experiments, each comprising 3 mice.

