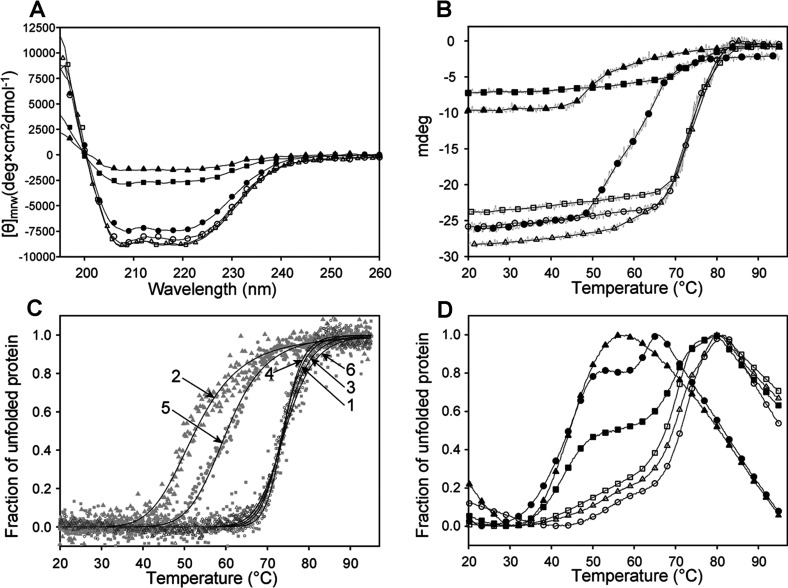
Figure 3. Conformational stability of wt HMBS and mutants, as studied by CD and DSF.
(A) Far-UV CD of wt (○), R116W (▲), K132N (∆), R167W (□), R173W (●) and V215E (■). [θ], mean residue ellipticity. (B) The CD-monitored thermal denaturation, presented as mdeg at 222 nm versus temperature. (C) The CD-monitored thermal denaturation, normalized to fraction of unfolded protein, and curve fitting to a two-state transition model for wt (1), R116W (2), K132N (3), R167W (4), R173W (5) and V215E (6). (D) Thermal denaturation monitored by DSF for wt (○), R116W (▲), K132N (∆), R167W (□), R173W (●) and V215E (■). A representative plot of each of four parallels is shown in the figure. The Tm-values obtained from (C) and (D) are summarized in Table 4.

