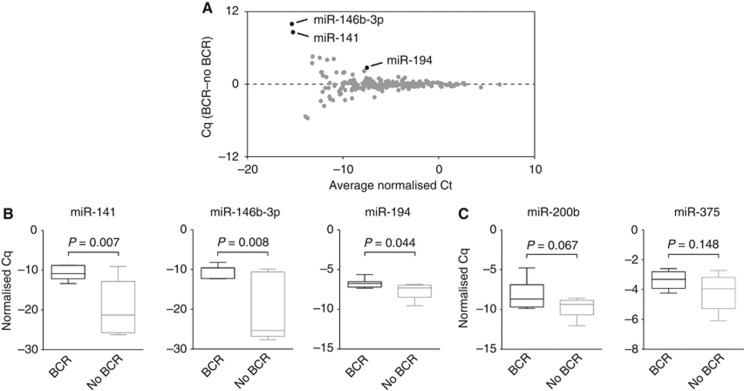
Figure 1.
Circulating miRNA markers of biochemical recurrence (BCR). (A) Bland–Altman mean-difference plot of 217 circulating miRNAs detected in a screening cohort of prostate cancer patients. MiRNAs found to be significantly differentially expressed between the BCR (n=8) and no BCR (n=8) groups are shown in black. (B) Relative levels of miR-141, miR-146b-3p and miR-194 in the serum of men who experienced BCR and men who did not. Statistically significant differences were assessed using a t-test; P-values are shown. The lines within boxes represent the median, the horizontal borders of each box represent the 25th and 75th percentile, and the limits of the vertical lines represent the maximum and minimum Cq. (C) Relative levels of miR-200b and miR-375 in the serum of men who experienced BCR and men who did not, graphed as described in (B).

