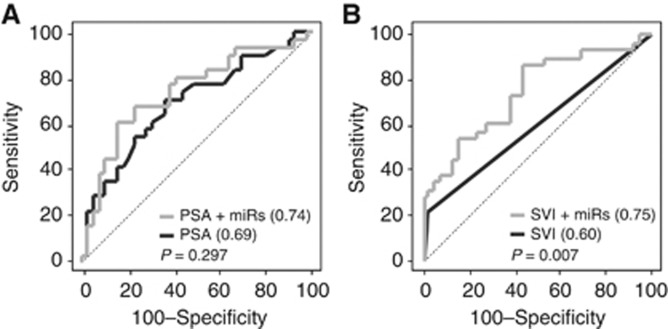
Figure 5.
ROC curve analysis in the validation set (n=70) comparing the ability of clinical parameters alone or in combination with circulating miRNAs to identify men who experience biochemical recurrence. (A) Comparison of pre-operative PSA alone (dark grey) or combined with circulating miR-146b-3p and miR-194 (light grey). (B) Comparison of seminal vesicle invasion (SVI) alone (dark grey) or combined with circulating miR-146b-3p and miR-194 (light grey). Area under the curve (AUC) is shown in brackets. The Delong method was used to compare the AUCs; P-values are shown.

