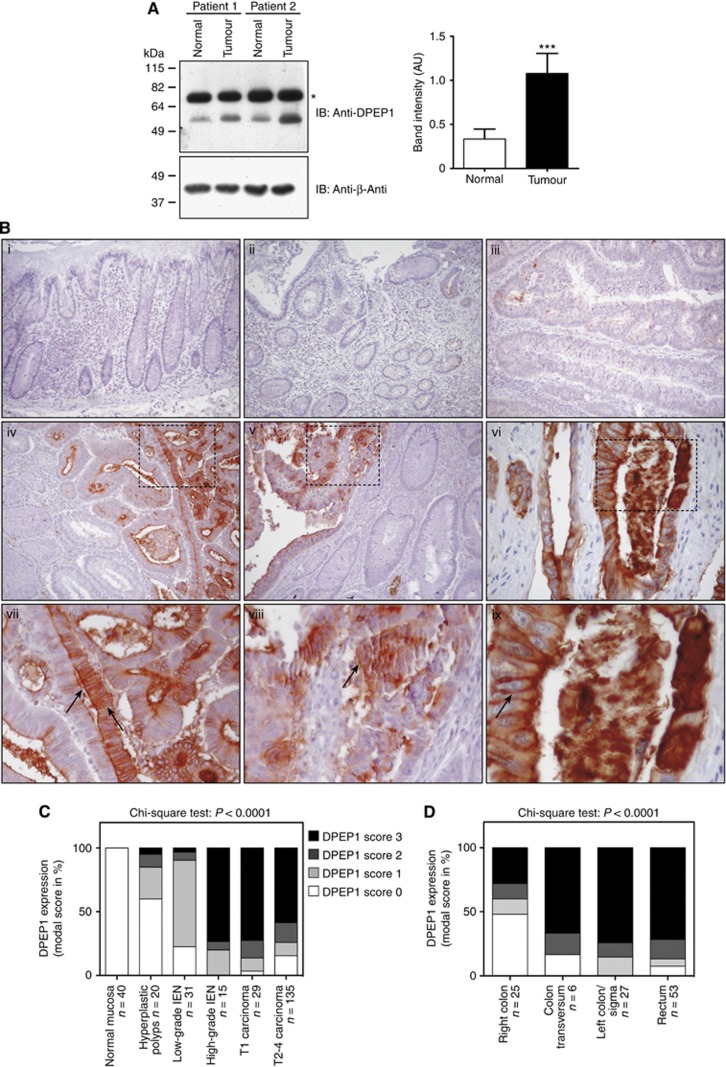
Figure 4.
High DPEP1 protein expression correlates with high-grade IEN and tumour localisation. (A) Protein was extracted from tumour and non-cancerous tissue of multiple patients. The cell lysates of two representative patient samples were immunoblotted with an anti-DPEP1 and an anti-β-actin antibody. The semi-quantitative analyses of band intensities, using immunoblots of overall 13 paired patient tissue samples, are shown±s.e. with P<0.0001 (***), Student's t-test. *, non-specific band. AU, arbitrary units; IB, Immunoblot. (B) Immunohistochemical analysis of DPEP1 expression in surgical specimens of CR epithelia during tumour progression. Arrows indicate the apical and circumferential staining pattern of DPEP1. (i) Normal colonic mucosa, (ii) hyperplastic polyp, (iii) tubular adenoma with low-grade dysplasia, (iv) tubular adenoma with high-grade dysplasia, (v) transition between low-grade to high-grade dysplasia and carcinoma as well as (vi) carcinoma. Panels (vii–ix) show magnified portions of each image as indicated (dashed squares). (C) DPEP1 expression in correlation with tumour stage was analysed using FFPEs of normal mucosa (n=40), hyperplastic polyps (n=20), adenomas with low-grade IEN (n=31), adenomas with high-grade IEN (n=15), T1 carcinomas (n=22) as well as the CRC-TMA bearing T1 (n=7) and T2–T4 carcinomas (n=135). (D) DPEP1 expression in correlation with tumour localisation was analysed using the CRC-TMA with clinical specimen of right colon (n=25), colon transversum (n=6), left colon/Sigma (n=27) and rectum (n=53). Cases with missing information concerning CRC localisation were omitted.

