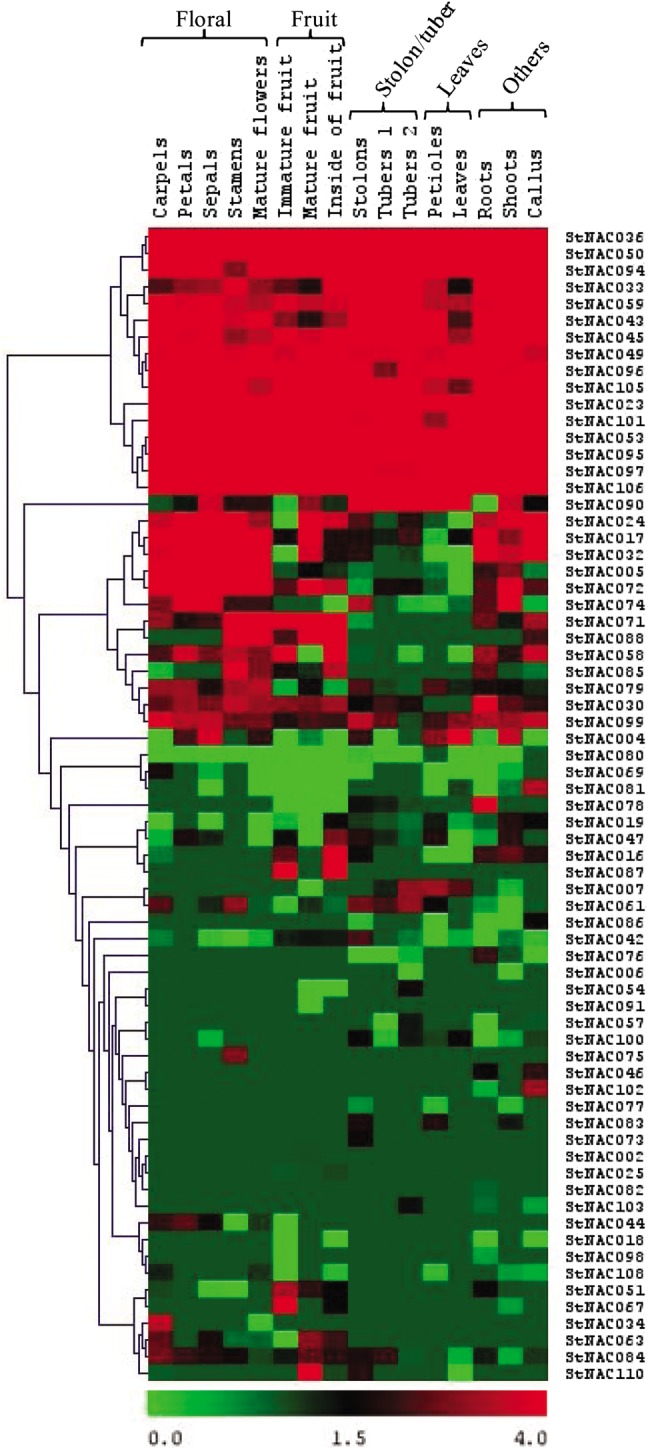
Figure 6.

Heat map representation and hierarchical clustering of StNAC genes across different tissues and developmental stages. The Illumina RNA-seq data were reanalyzed, and the FPKM values were log2 transformed and heat map generated using TIGR MeV v4.1.1 software. Bar at the bottom represents log2 transformed values, thereby values 0, 1.5 and 4.0 represent low, intermediate and high expression, respectively.
