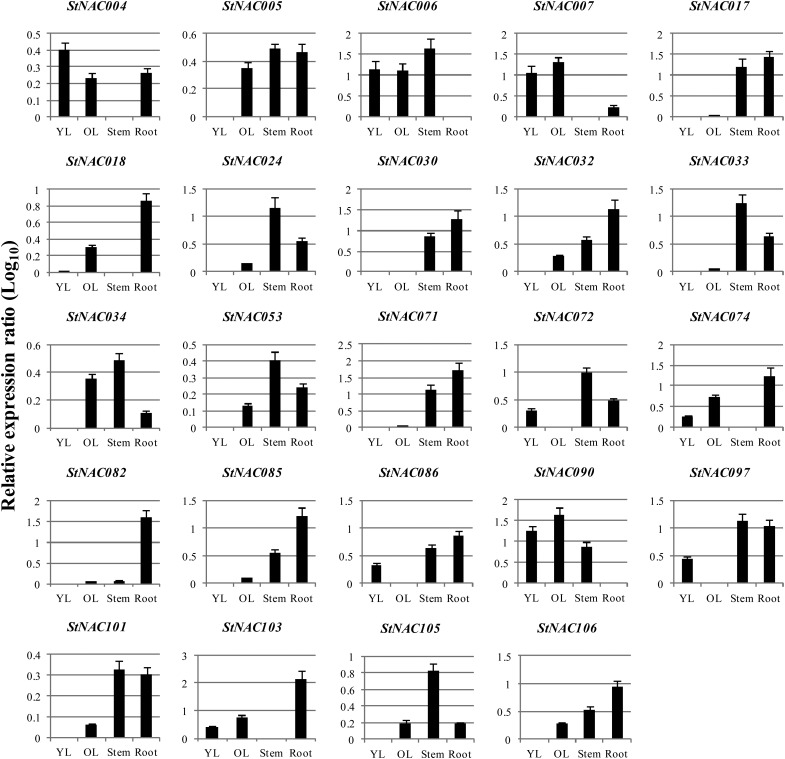
Figure 8.
The relative expression ratio of 24 representative StNAC genes in young leaf (YL), old leaf (OL), stem and root tissues of potato determined using qRT-PCR. Relative expression ratios in different tissue samples have been calculated with reference to tissue sample in which the respective transcript exhibited the lowest expression. The relative expression values were log10 transformed. qRT-PCR data were normalized using potato elongation factor 1-α gene. The name of the gene is written on the top of each bar diagram. (Error bars indicate standard deviation.)

