
Figure 3.
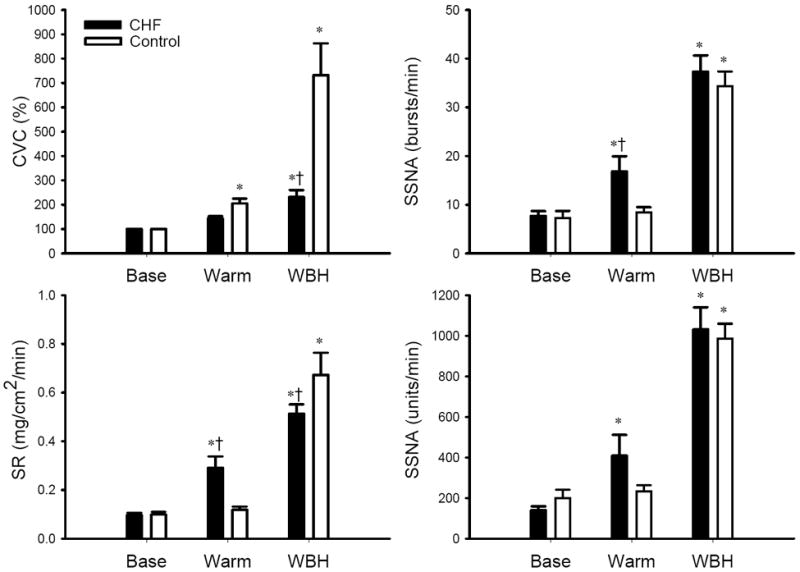
SSNA, CVC and SR responses to Warm and WBH. CVC is expressed as percent of normothermic baseline (Base). Warm and WBH: see definition in Figure 1. *: significantly different from Baseline (P<0.05). †: significantly different from Control subjects (P<0.05). For CVC (left upper panel), P=0.002 for subject groups; P<0.001 for heating, P<0.001 for the interaction. For SR (left lower panel), P=0.931 for subject groups; P<0.001 for heating, P=0.003 for the interaction. For SSNA burst rate change (right upper panel), P=0.04 for subject groups; P<0.001 for heating, P=0.049 for the interaction. For SSNA total activity change (right lower panel), P=0.342 for subject groups, P<0.001 for heating, P=0.238 for the interaction.