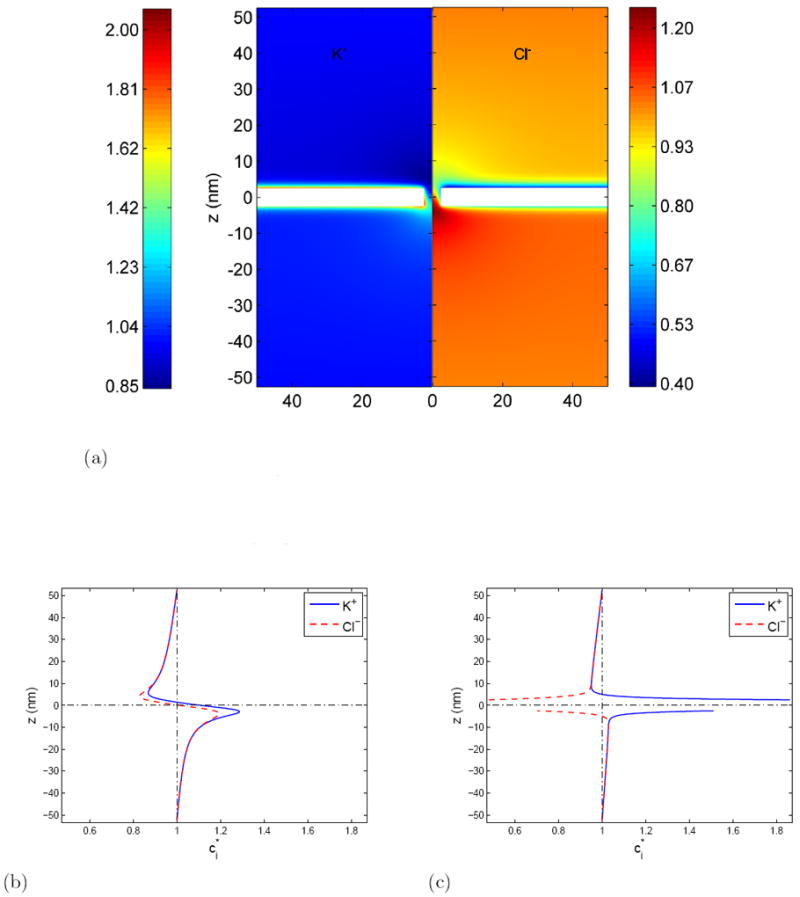
Figure 2.

Equilibrium ionic distributions in the nanopore system. The parameters are: Σ =-0.01 C/m2 ΔV =0.4 V and c0 =0.1 M.
(a) The steady state concentration distribution (normalized by the bath concentration, c0) in the nanopore system. The system is axisymmetric. For convenience, the left panel shows the concentration distribution of potassium ions, K+ and the right panel is used for chloride ions, for Cl−.
(b) Normalized ion concentrations along line r = 0 (pore center line)
(c) Normalized ion concentrations along line r = 30 nm (faraway from pore)
