Figure 3.

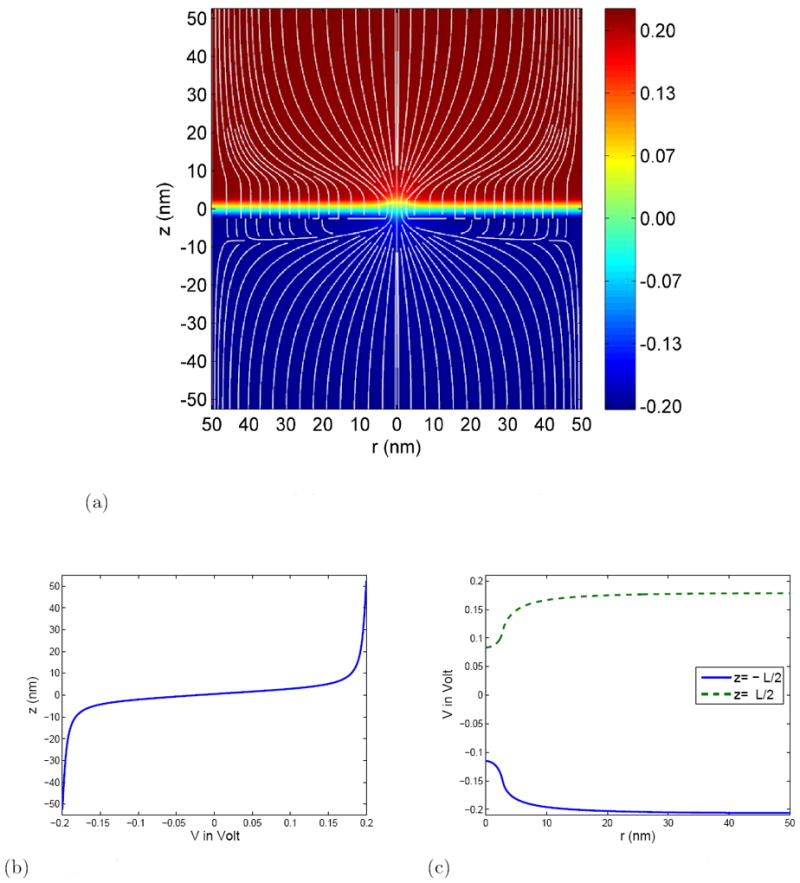
The electric potential distribution in the nanopore system. Parameters are, Σ =-0.01 C/m2 ΔV =0.4 V and c0 =0.1 M.
(a) The electric potential distribution. The numerical values in the color map are in Volt and field lines are shown in white.
(b) Distribution of the electric potential along the z–axis.
(c) The radial distribution of the electric potential along the upper and lower membrane surface (z = ±L/2).
