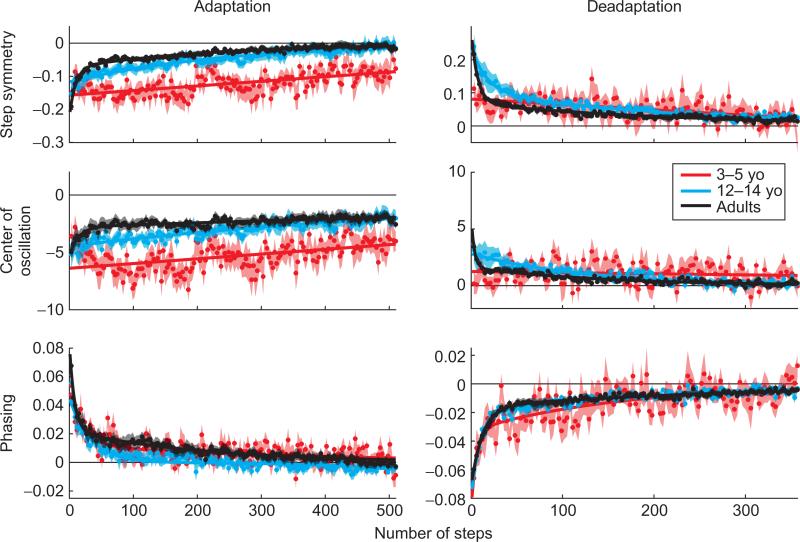
Fig. 2.
Rates of adaptation (left column) and deadaptation (right column) in 3- to 5-year olds (red; n=10), 12- to 14-year olds (blue; n=10), and adults (black; n=10). Step symmetry data are shown in the top row, center of oscillation difference in the middle and phasing on the bottom. Shaded regions indicate standard error. Data were fit with linear, single-exponential, or double-exponential functions depending on which fit resulted in the highest r2 values. For 3- to 5-year-old step symmetry and center of oscillation difference, linear fits were best; double-exponential fits were best for the phasing data. A single exponential fit was used for 12- to 14-year-old center of oscillation difference adaptation data and all remaining 12- to 14-year-old data were best fit by double-exponential functions. All adult data were fit by double-exponential functions.

