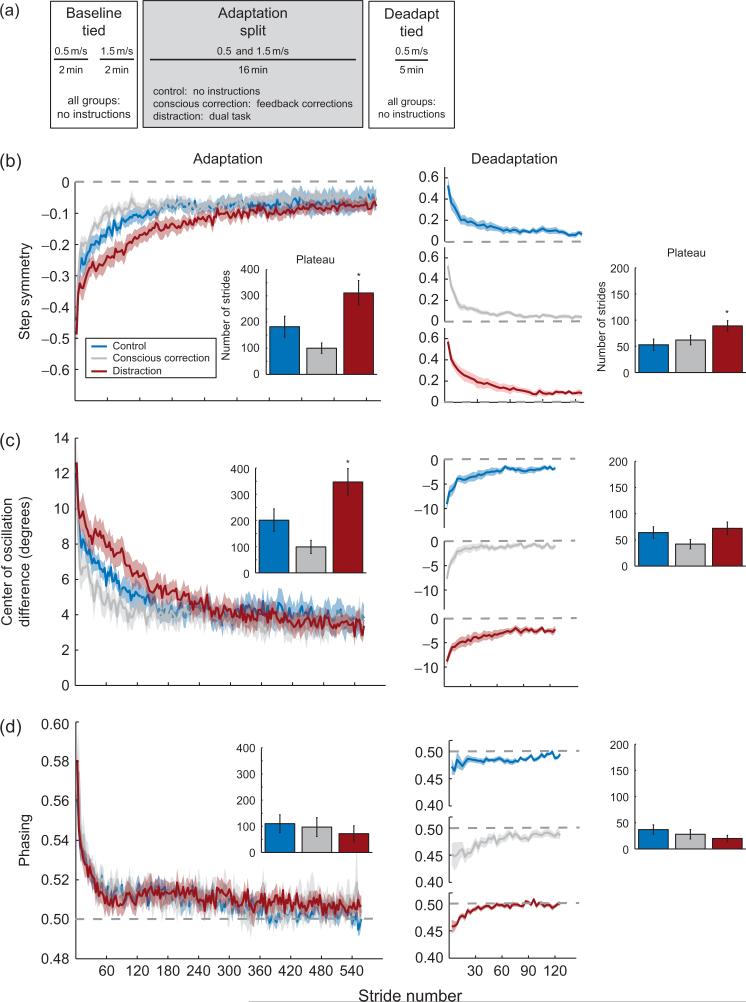
Fig. 3.
(a) Experimental paradigm showing the periods of split-belt walking and conditions. In baseline, tied walking all groups were given no specific instructions. Subjects were divided into three groups for adaptation (split belts). The conscious correction group (N=11) was instructed on how to step more symmetrically and given intermittent visual feedback of their stepping during adaptation. The distraction group (N=11) was given an auditory and visual dual-task they were asked to focus on. The control group (N=11) was given no specific instructions. In deadaptation (tied belts), all groups walked under “Control” conditions, where the visual feedback and distracter were removed. (b) Adaptation and deadaptation curves for step symmetry. Average adaptation curves for the three groups, with standard errors indicated by the shaded area. Baseline values are subtracted out from curves (i.e., symmetry is indicated by a value of 0). Average deadaptation curves for the three groups. Recall that all groups deadapted under the same condition (no feedback or distraction). Curves are shown individually to more clearly illustrate the plateau level. Bar graphs represent group averages for adaptation and deadaptation rate, assessed by the number of strides until plateau is reached (i.e., behavior is level and stable). Note that with step symmetry, the conscious correction group adapted faster, and the Distraction group adapted slower. However, retention was improved with the Distraction group because they took longer to deadapt, despite removal of the distracter. (c) Adaptation and deadaptation curves for the center of oscillation difference. Average adaptation curves for the three groups plotted as in (b). Trends seen in the center of oscillation difference are comparable to those seen in step symmetry. (d) Average adaptation and deadaptation curves for phasing, plotted as similar to (b). Note that our interventions did not significantly affect the rate of adaptation or deadaptation of phasing.

