
Figure 6. .
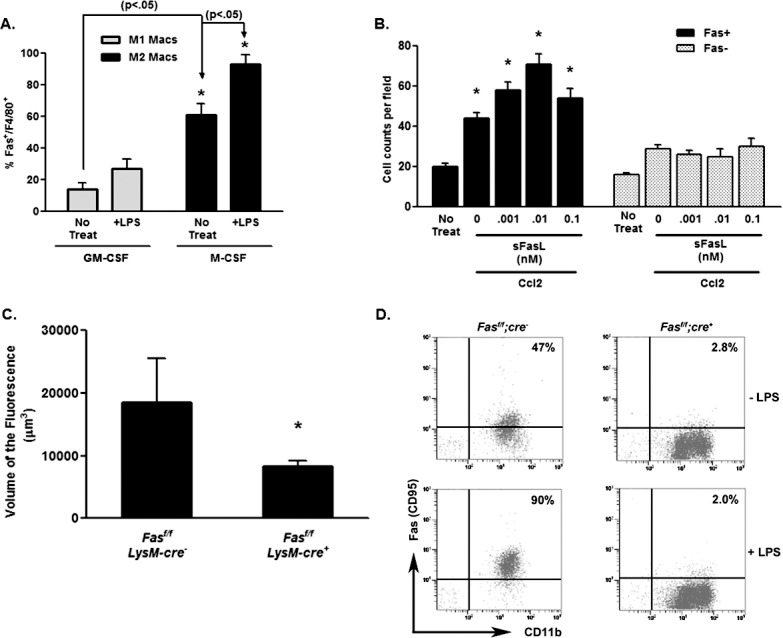
Fas expression on M1 and M2 macrophages. (A) Fas expression on bone marrow–derived M1 (GM-CSF) and M2 (M-CSF) macrophages was determined by flow cytometry gating on the F4/80+ cells. (B) Migration of bone marrow–derived macrophages from control (Fasf/f;LysM-cre−) and Fas-deficient (Fasf/f;LysM-cre+) macrophages was determined in the presence or absence of sFasL and Ccl2. The asterisk (*) denotes significantly different from untreated controls (No Treat). (C) Littermate control Fasf/f;LysM-cre− and Fas-deficient Fasf/f;LysM-cre+ mice were laser treated and the volume of CNV lesions (expressed as volume of the fluorescence) was assessed on day 7. Asterisk (*) denotes significantly different from littermate control (P < 0.01). (D) Bone marrow–derived macrophages from Fasf/f x LysM-cre mice and littermate control mice were examined for Fas expression by flow cytometry. Percentage of the Fas+, CD11b+ cells for each group are shown and were determine before (−LPS) and after (+LPS) treatment with LPS for 24 hours.