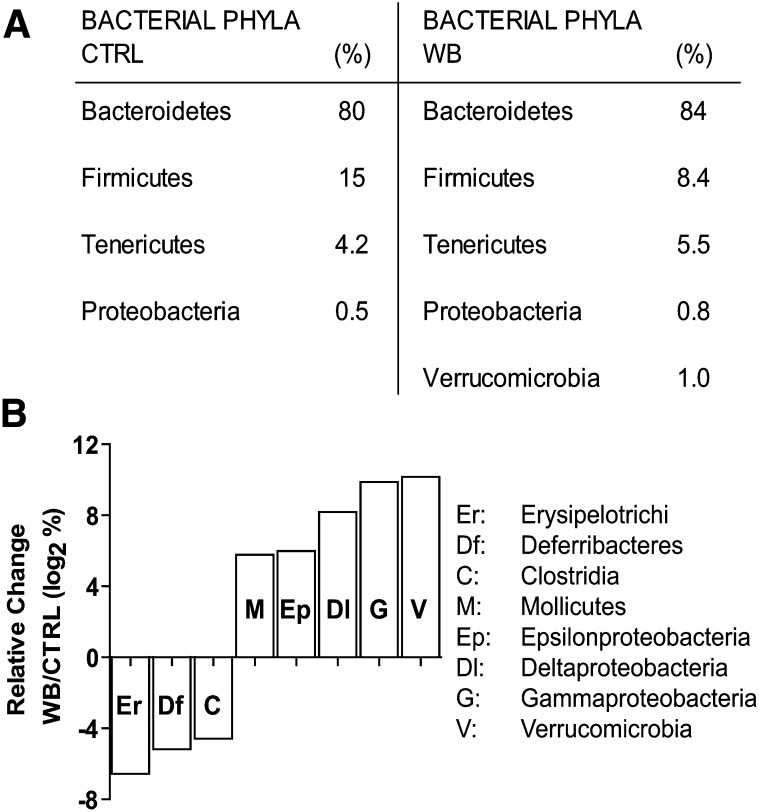
FIGURE 2.
Bacterial metagenomic analysis of the phylum and class level differences evident in the DNA isolated from the feces of 2 male mice fed CTRL or 2 male mice fed WB diets for 6 wk. (A) The frequency of the different phyla sequenced from CTRL- and WB-fed mice. (B) Relative change in the class of bacteria found in WB-fed mice relative to CTRL. Values are the mean frequencies of the bacterial sequences from 2 mice in each treatment group. Values that are negative show class-level species that are inhibited by WB feeding. Values that are positive show class-level species that are more prevalent in WB-fed mice. Only significant changes are graphed (P < 0.001). CTRL, control; WB, white button.

