Figure 5.

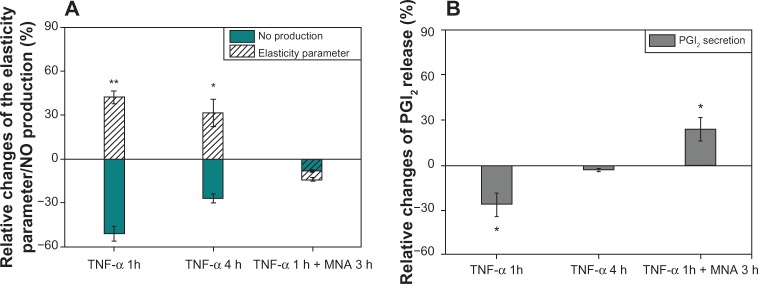
Relative changes of elasticity parameter, NO production, and PGI2 release.
Notes: (A) Elasticity parameter (white-striped bars)/NO production (blue bars). (B) PGI2 release for selected incubation conditions: TNF-α (1 hour [h]); TNF-α (4 hours); and TNF-α (1 hour) + MNA (3 hours). The relative changes of NO production/PGI2 secretion were calculated compared to the control level (1.83 ± 0.4 μ M)/(5.97 ± 0.84 ng/mL) (mean ± SD). The statistically significant differences from the native samples are *P< 0.05 and **P< 0.01.
Abbreviations: TNF-α, tumor necrosis factor-alpha; MNA, 1-methylnicotinamide chloride; NO, nitric oxide; PGI2, prostacyclin; SD, standard deviation.
