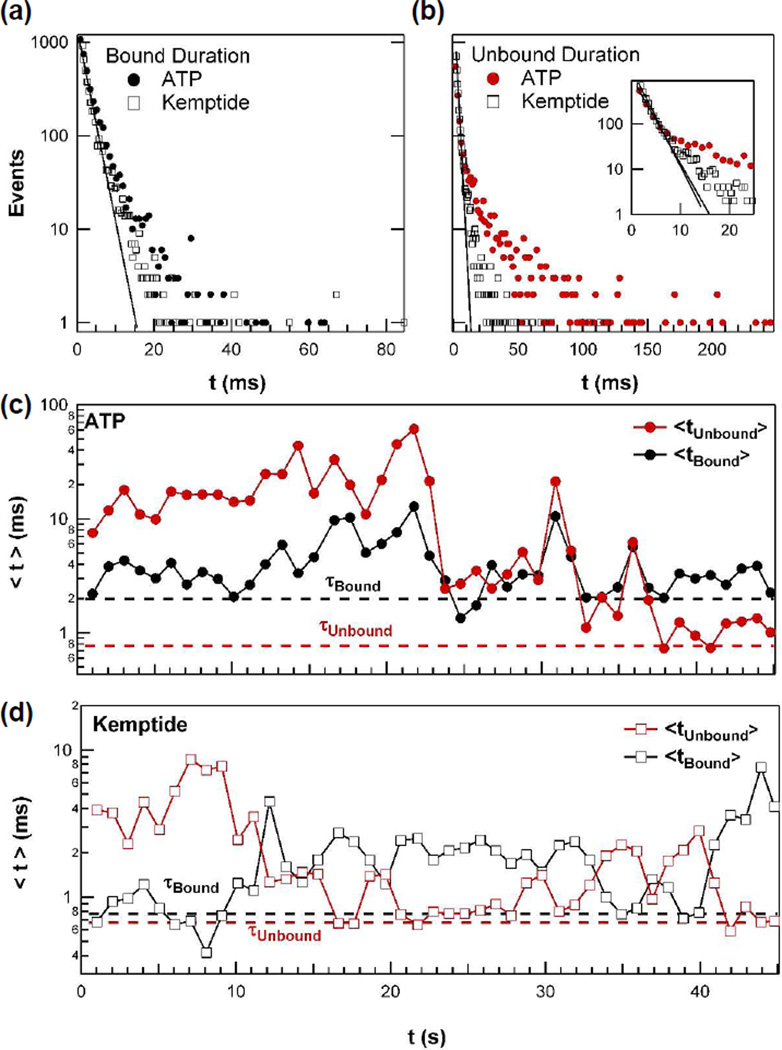
Figure 3.
Dynamic disorder of PKA observed by single molecule measurements with either ATP or Kemptide. (a) Distributions of the duration of the enzyme bound conformation for ATP or Kemptide. (b) Distributions of the waiting times for ATP and Kemptide binding, with the shortest waiting times shown more clearly in the inset. In (a) and (b), single-exponential line fits determining τ are shown as solid lines. (c) Variation in the 1-second arithmetic mean values <t> of ATP binding kinetics. These values were calculated by averaging the indicated one second of data. The corresponding τ values from the exponential fit are indicated by dashed lines for comparison. (d) The analogous variation in Kemptide binding kinetics.

