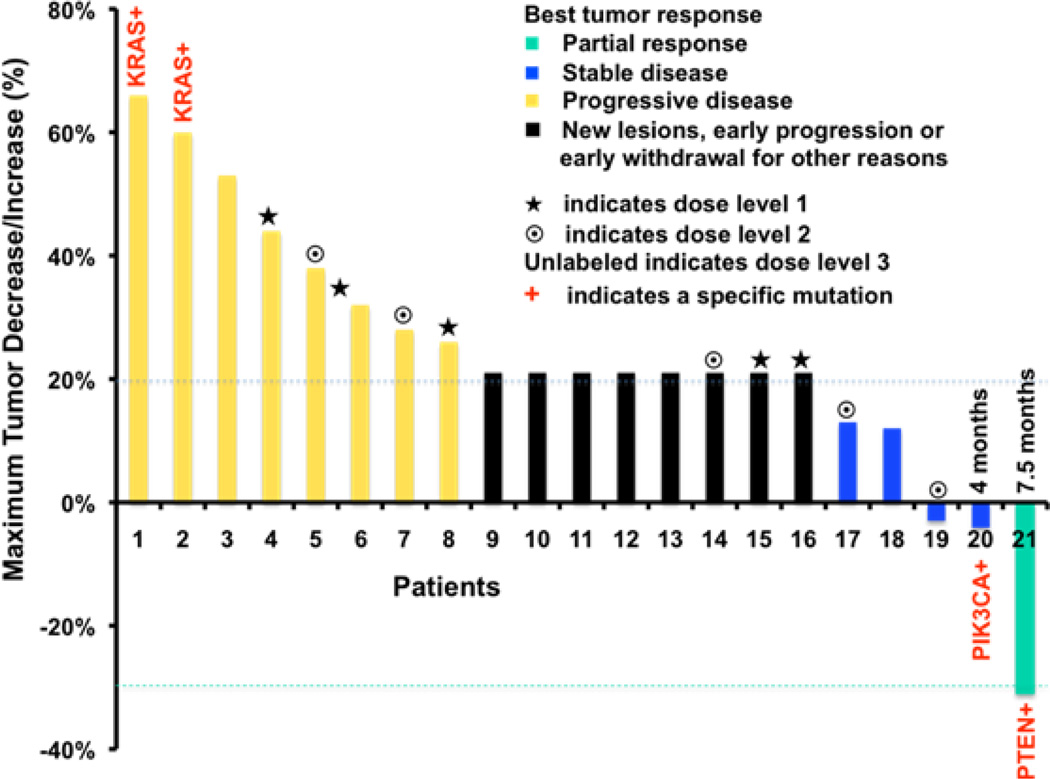
Figure 1.
The waterfall plot displays best tumor responses by RECIST 1.0 criteria. All 21 patients were evaluated. Patients represented by black bars either have new lesions or early progression, or early withdrawal for other reasons. They are arbitrarily designated as having a 21% progression. Duration of response and stable disease are indicated.

