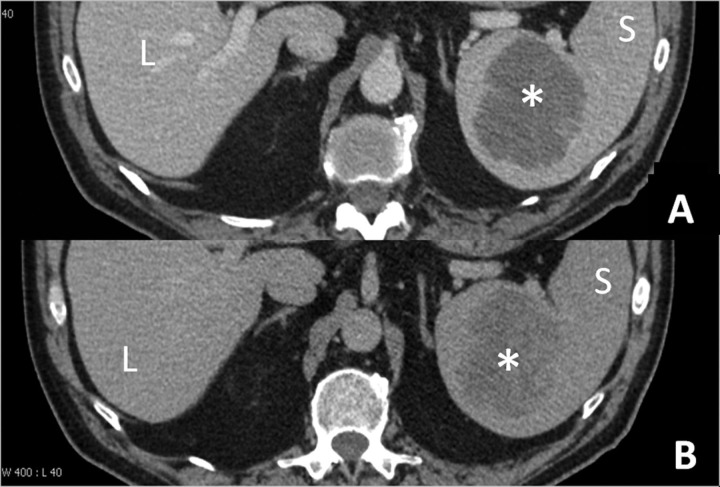
Fig. 1.
Initial CT scan of abdomen in the portal venous phase (a) and the 4 min delayed excretory phase (b). A 6-cm mass was seen in the spleen with density of 42 Hounsfield units (HU) on portal venous phase image that did not change on delayed images. A subsequent CT scan of abdomen was performed without contrast and demonstrated the density of lesion was 28 HU (image not shown) indicating that there was mild enhancement in the splenic lesion retrospectively. L, liver; S, spleen; *, splenic mass

