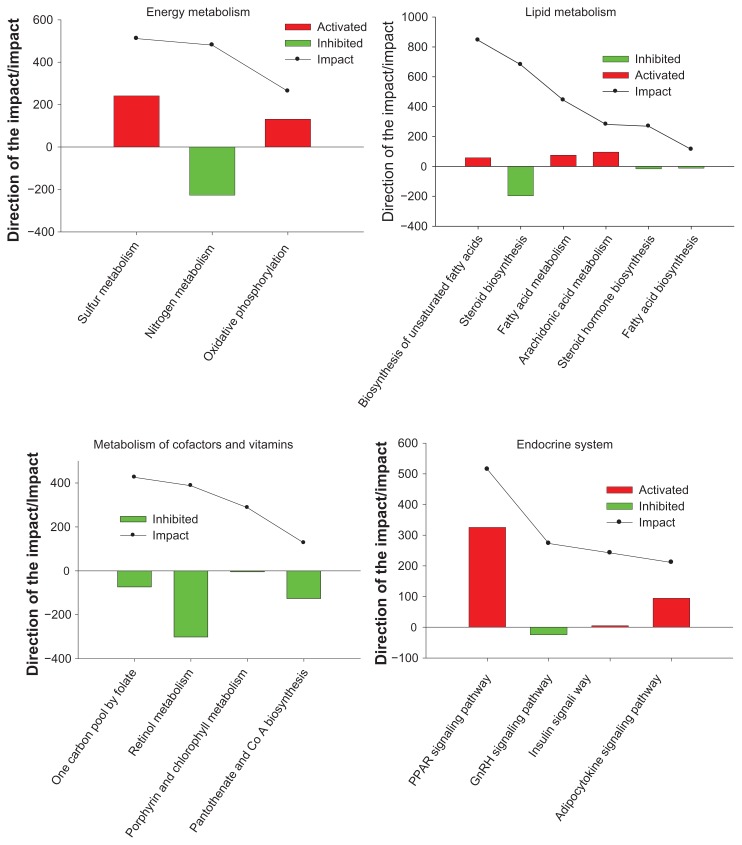
Figure 4.
Results of the most impacted pathways during the growing phase and finishing phase (220 vs. 0) uncovered by the Dynamic Impact Approach (DIA) based on Kyoto Encyclopedia of Genes and Genomes (KEGG) Pathways database analysis of the bovine muscle transcriptome. Columns represent the direction of the pathway (green color = inhibition, red color = activation). Continuous black lines show the impact of each pathway (P value < 0.05; FDR < 0.01).

