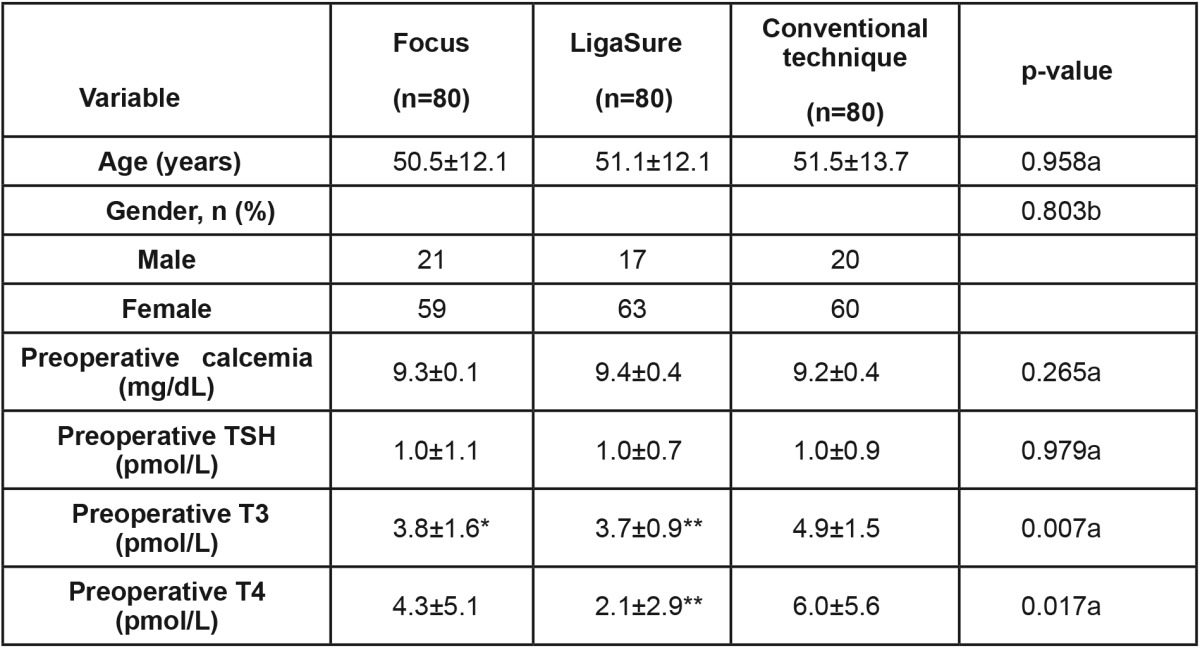
Table 1. Patients’ demographics and laboratory measurements.

All P<0.05, are reported for statistical significance. a Kruskal-Wallis test; b Chi square test; * p<0.05; ** p<0.01 post hoc test vs control group (conventional technique group). SD: Standard Deviation, range
