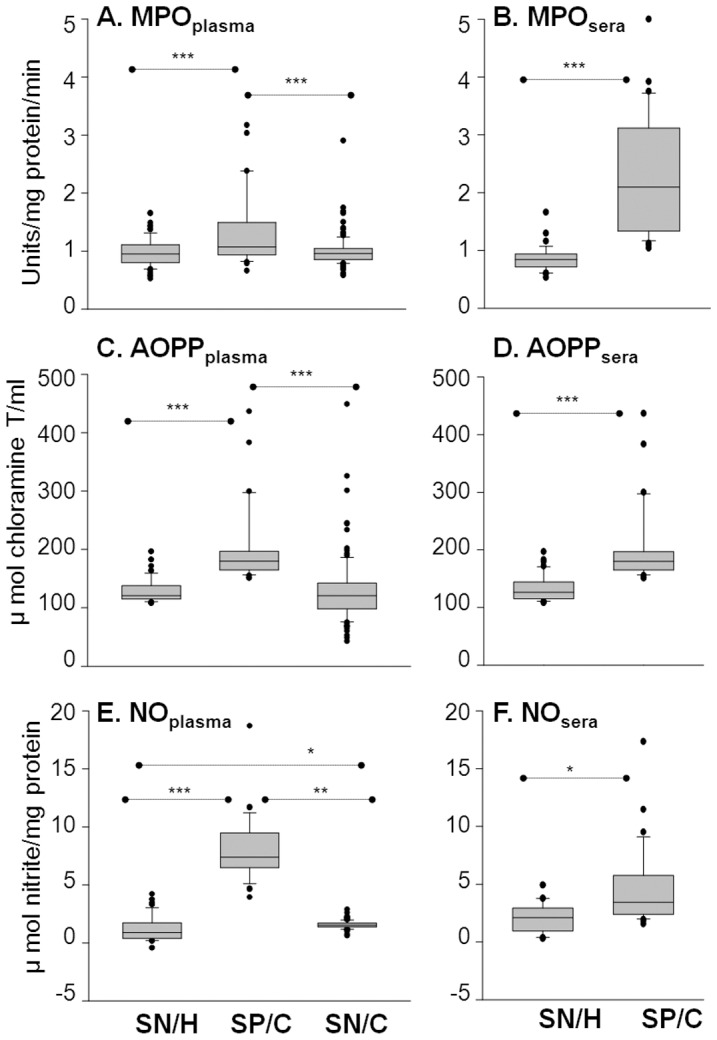
Figure 1. Neutrophil (MPO) and macrophage (iNOS) activation indicate inflammatory state of seropositive/chagasic subjects.

Plasma and sera samples were obtained from seronegative/healthy (SN/H), seropositive/chagasic (SP/C) and seronegative/cardiac (SN/C) subjects, as described in Materials and Methods. Shown are the plasma ( A,C,E ) and sera ( B,D,F ) levels of MPO activity (A&B), AOPP contents (C&D) and nitrite levels (E&F). For all figures, data (mean of triplicate observations from each sample) are presented as box plot. The horizontal lines of the box (bottom to top) depict the lower quartile (Q1, cuts off lowest 25% of the data), median (Q2, middle value), and upper quartile (Q3, cuts off the highest 25% of the data). The lower and upper whiskers depict the smallest and largest non-outlier observations, respectively, and solid dots represent the outliers. The spacing between the different parts of the box indicates the degree of dispersion (spread). Standard deviation for triplicate observations for all samples was <12%. Significance is shown as *p<0.05, **p<0.05, and ***p<0.001.
