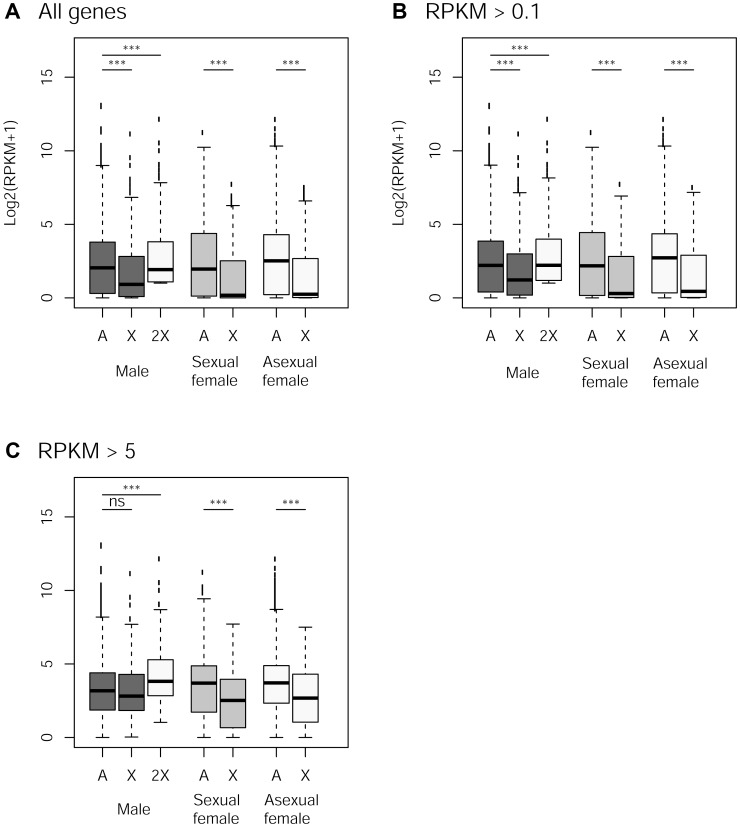
Figure 4. Expression rate of X-linked and autosomal genes in males, sexual females and asexual females.
Panels A to C: Log2 expression (RPKM+1) for autosomal and X-linked genes in the different reproductive morphs (males, sexual females, asexual females) for different cut-offs in gene expression. The white box for males represents X-linked genes with doubled expression to account for the haploid state of X chromosome in males. Difference in gene expression between X and autosomes within each morph was tested with Wilcoxon Rank sum tests.

