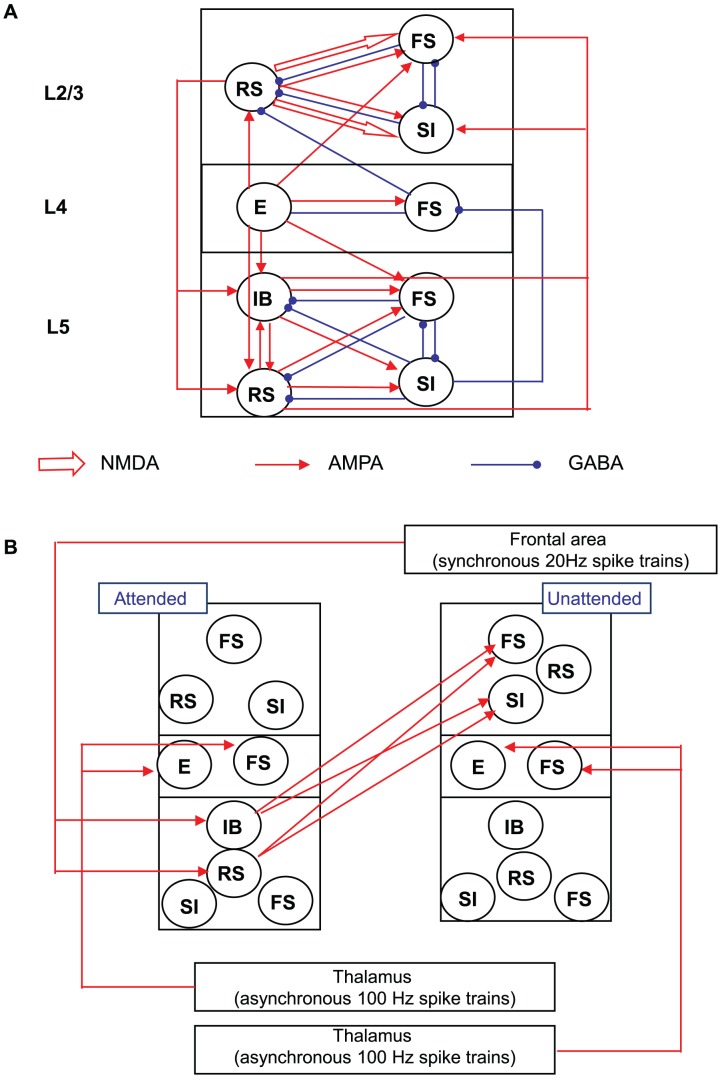
Figure 1. The structure of the model.
(A). Structure of a single column. Each circle is a population of 20 cells. Open and solid arrows represent NMDA and AMPA synapses respectively. Blue circles are GABA synapses. (B). Full model. Two columns interact with each other via ascending excitatory synapses from L5 pyramidal cells to L2/3 FS and SI cells. Both columns receive 100 Hz Poisson EPSC trains. Synchronous top-down signals are introduced into the attended column only. For clarity, we do not display recurrent connections inside the population of the same type: all cells interact with others that belong to the same population (see Methods).

