
Figure 1. Proportion of symptomatic infections by year and infection number.
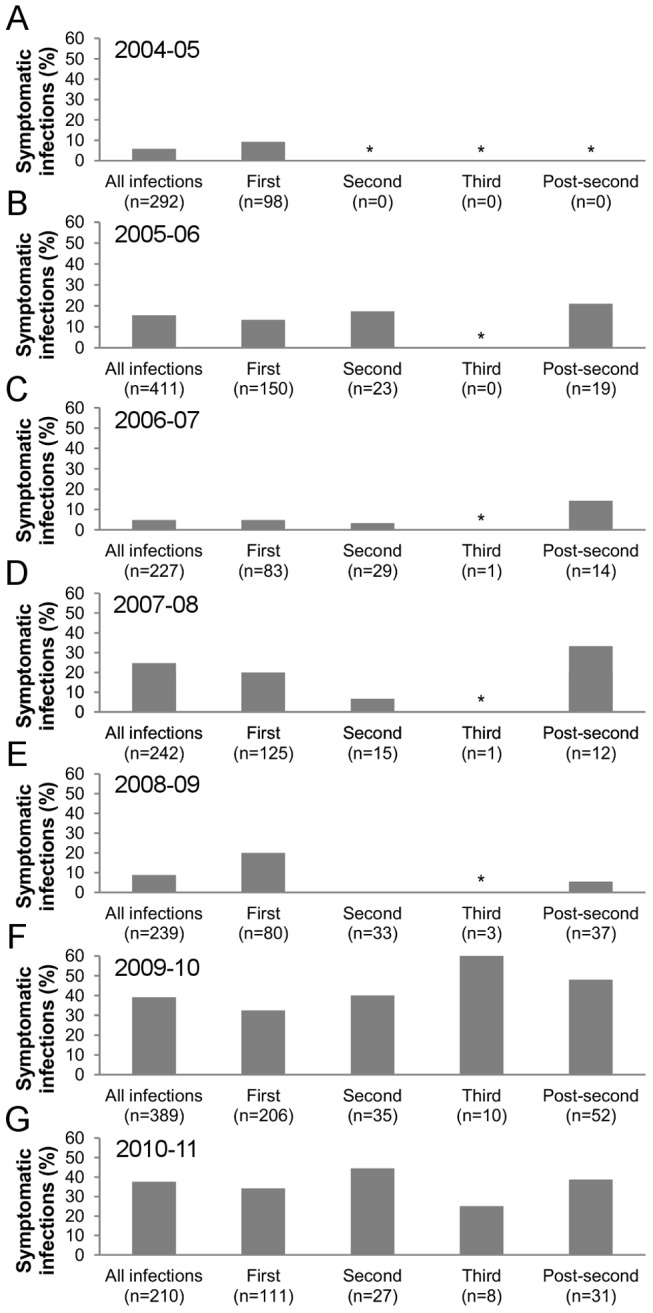
(A–G) Proportion of symptomatic infections in all, first, second, third and post-second infections by study year (2004–05 to 2010–11). * The proportion of symptomatic infections was not calculated when the total number of infections per group was ≤5.