
Figure 4. Quantification of vaso-obliteration and cell death in P18 Sprague-Dawley rats.
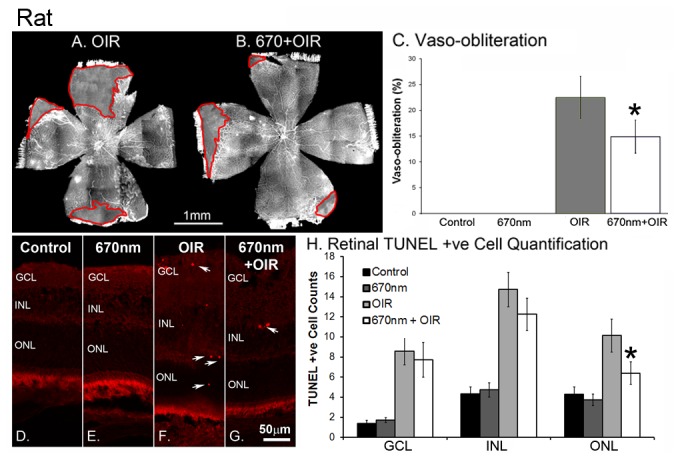
(A) OIR shows increased vaso-obliteration (C) compared to 670nm + OIR (B). Red (A, B) areas show vaso-obliteration. Representative images (D–E) and quantification (H) of TUNEL images from the rat retina. To maintain consistency representative images (D–E) were all taken 500µm from the optic nerve head on the superior side of the retina. Arrows indicate positive cell labelling in both the OIR and 670nm+OIR animals. Control and 670nm (dark showed little TUNEL positive labelling (H) in any of the retinal layers, while experimental groups exposed to OIR showed increased labelling compared to control levels (H). 670nm+OIR reduced the level of labelling from that of OIR, but only with statistical significance in the ONL (H). * indicated statistical significance p <0.05. Error bars show standard error. Arrows indicate positive cell labelling. GCL – ganglion cell layer, INL – Inner nuclear layer, ONL – outer nuclear layer, P – postnatal day, OIR - Oxygen Induced Retinopathy. Scale A,B = 1mm, D-G = 50µm. Graph bar fills indicate controls (black), 670nm treated (dark grey), OIR (light grey) and 670nm+OIR (white).