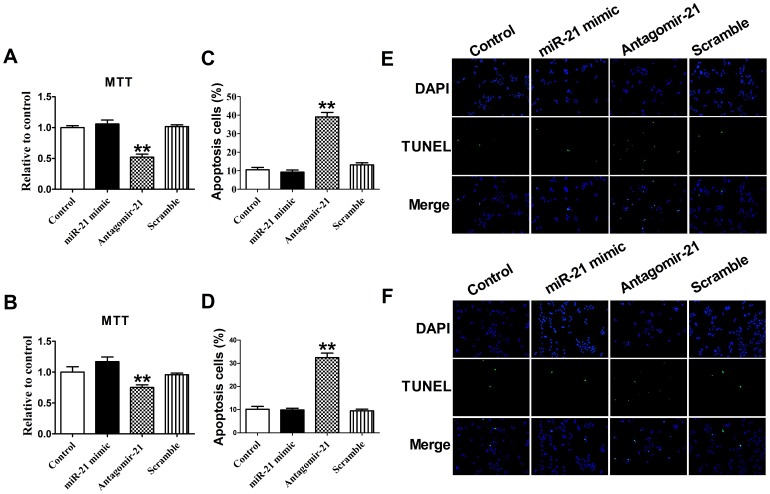
Figure 1. The effect of miR-21 antagomir on the cell proliferation and apoptosis.
MTT assay of 4T1 cells (A) and HUVECs (B). Data are expressed as mean ± SEM, n = 3, **P<0.01 vs control. Quantification of apoptotic 4T1 cells (C) and HUVECs (D) were determined and shown in the diagram. The number of apoptotic cells was significantly increased in cells transfected with antagomir-21 than in control group. Data are expressed as mean ± SEM, n = 10, **P<0.01 vs control. (F). Apoptotic 4T1 cells (E) and HUVECs (F) were determined by TUNEL staining and visualized at 200× magnification. Green color is TUNEL staining representing apoptotic cell; blue color is the cell nucleus stained by DAPI.

