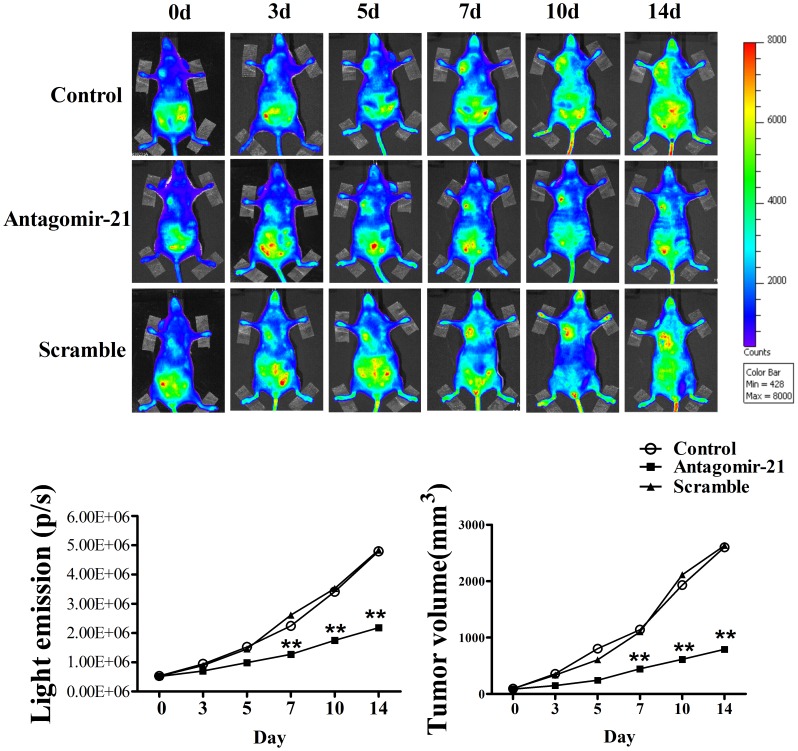
Figure 3. Bioluminescent imaging of tumor angiogenesis and change of tumor volumes.
(A) Bioluminescent images of tumor-bearing mice were obtained at 0, 3, 5, 7, 10 and 14 d in the same imaging conditions. (B) The dynamic measurement of bioluminescent intensities in tumors treated with miR-21 mimic, antagomir-21 or scramble. Regions of interest (ROI) from displayed images were identified on the tumor sites and quantified as photons per second (p/s). (C) Tumor volume curves in mice treated with saline, antagomir-21 or scramble. Data are all shown as mean ± SEM. n = 5 in each group. **P<0.01, as compared with control.

