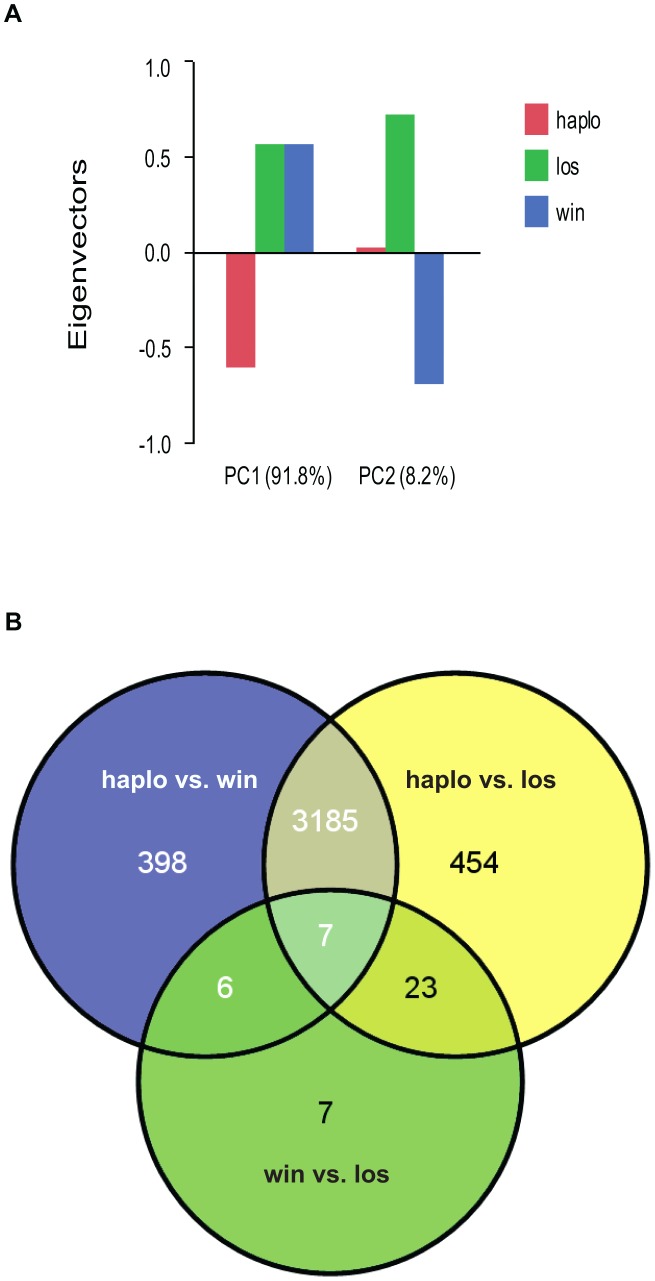
Figure 1. Analyses of global gene expression between haplometrotic and pleometrotic queens.
A) Principal Component Analysis of 4080 significantly differentially regulated transcripts. Two PCAs were identified corresponding to the effect of social environment (single queen vs. paired queens, 91.8%) and social rank (winner vs. loser, 8.2%). B) Pairwise comparisons of 4080 significantly differentially regulated transcripts. A total of 3192 transcripts were different between haplometrotic and pleometrotic queens, while only 43 transcripts were different between winner and losers. Haplometrotic queens were more similar to pleometrotic winners than to pleometrotic losers: more transcripts were differentially regulated in haplo vs. los than in haplo vs. win (477 and 404, respectively): this difference was statistically significant (Nominal Logistic Fit: df = 1, ChiSquare = 6.78, P = 0.0092). haplo = haplometrotic queens; los = pleometrotic losers; win = pleometrotic winners.

