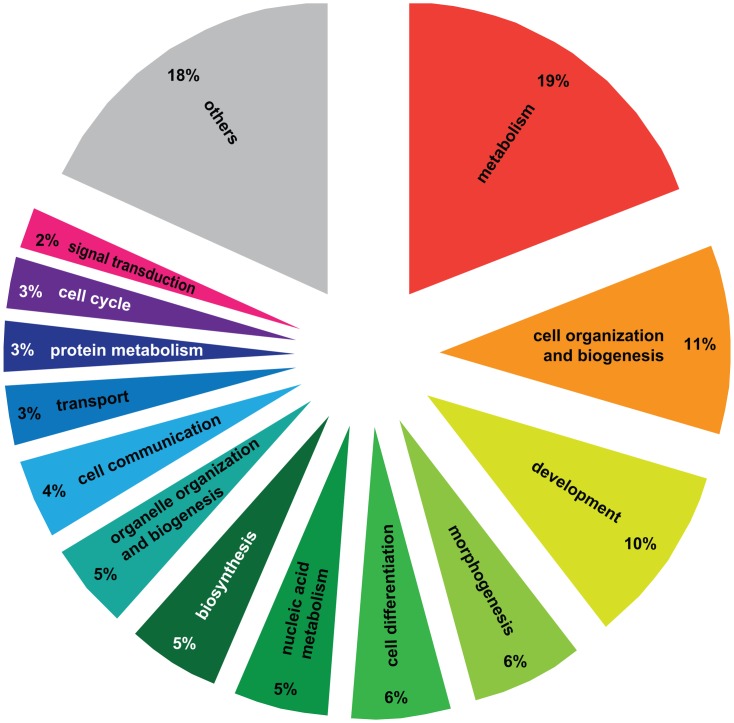
Figure 2. Gene Ontology analysis of genes differentially regulated between haplometrotic and pleometrotic queens.
The figure shows the larger functional groups that encompass significantly enriched GO terms resulting from the GO analysis. To obtain this result we overlapped the list of significantly enriched GO terms from experiment 1 (Functional Annotation Chart, P<0.05) with the GO_slim2 list of the cateGOrizer. Others = larger functional groups encompassing less than 2% of the total number of significantly enriched GO terms (see Table S3 for the complete list of ancestor GO terms).

