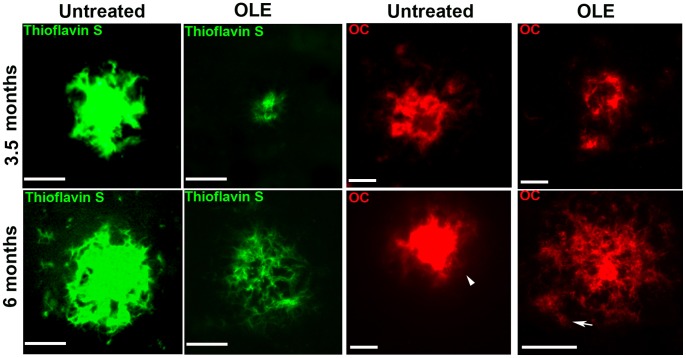
Figure 3. OLE modifies Aβ plaque load and morphology in the brains of TgCRND8 mice.
Representative photomicrographs of Thioflavin S histochemistry (green) (n = 4/group) and OC immunolabeling (red) (n = 5/group) of amyloid plaques in the cortex of untreated and OLE-fed Tg mice. In the OLE-fed Tg mice of 6 months of age several radiating plaques with ribbon-like/diffuse core and fluffy deposits (arrow) are present. Arrowhead indicates dense core amyloid plaques. Scale bars = 25 µm.

