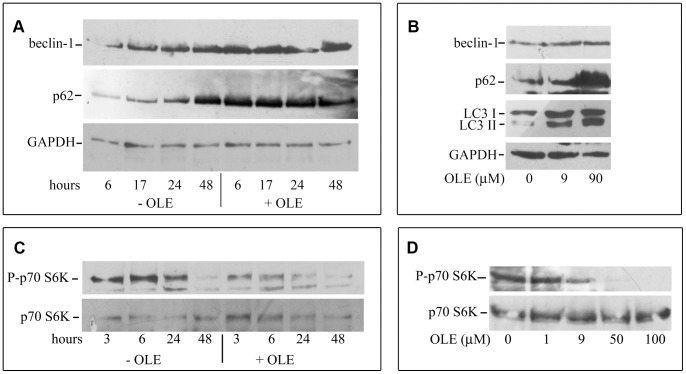
Figure 6. OLE activates autophagy in N2a murine neuroblastoma cells.
The cells were exposed to 90 µM (A) or 50 µM (C) OLE for increasing time periods. (B) and (D): the cells were exposed for 6 h to increasing OLE concentrations. Cells were lysed and analyzed by western blotting as described. This is a representative experiment out of three that gave qualitatively identical results.

