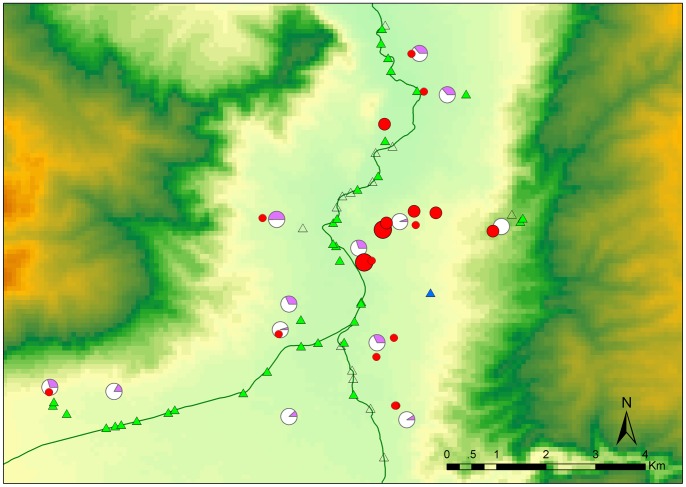
Figure 1. Geographical distribution of patients, cattle, goats and snails.
The patients are indicated by red filled circles and the number of cases in a household is denoted by circle size. The infected cattle and goats are showed in purple share of pie chart. Triangles denote the snail-collecting sites. Open triangles indicate that no snails were observed in the water ponds, blue ones indicate that infected snails were discovered.

