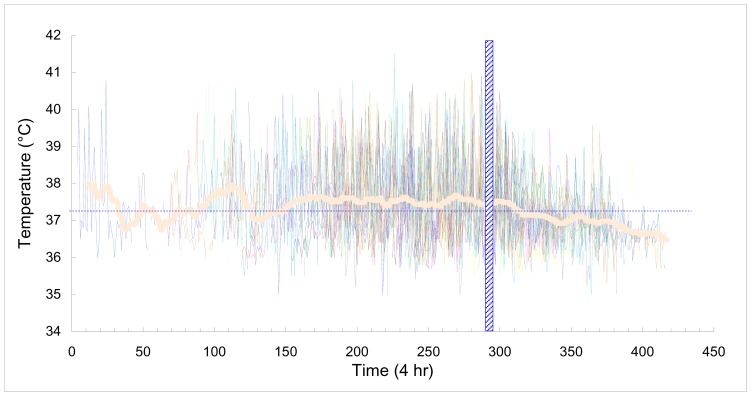
Figure 3. Axillary temperature profile of patients during the illness course.
The vertical hatched bar indicates the treatment date using triclabendazole. The fever is defined as over 37.2°C (dash line). The thick curve denotes the average temperature, which was produced by moving average with a period of 12 (equal to 3 days).

