
Figure 9. Calcium retention capacities of mitochondria from normal prostate PrEC, human lymphoblastoid (HLB) cells, and the prostate cancer PC-3 cells.
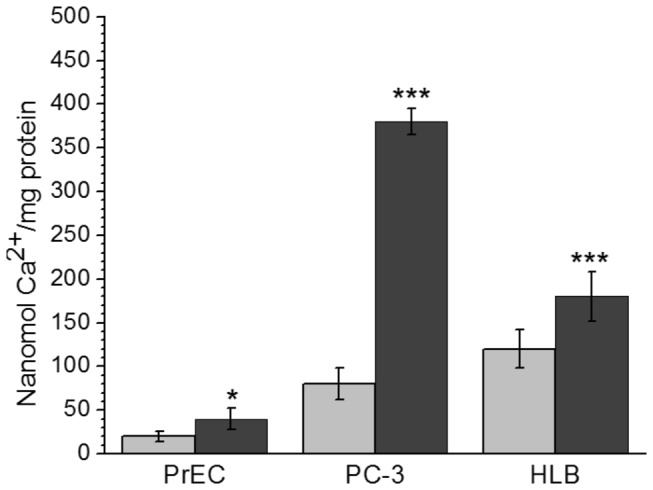
Incubation conditions as in Figures 7-8. Grey bars – unprotected mitochondria oxidizing succinate, dark bars –mitochondria protected by Cyclosporin A 0.5 µM + oligomycin 2 µg/ml + ADP 50 µM. Data are M ± standard error calculated from 3 separate isolations of mitochondria. Data are expressed as nanomol Ca2+/mg mitochondrial protein. Statistics: * p < 0.1; *** p < 0.001. The data for protected by CsA mitochondria were compared with the corresponding unprotected mitochondria. The data for the PC-3 cell mitochondria were compared with those for the PrEC cell mitochondria.