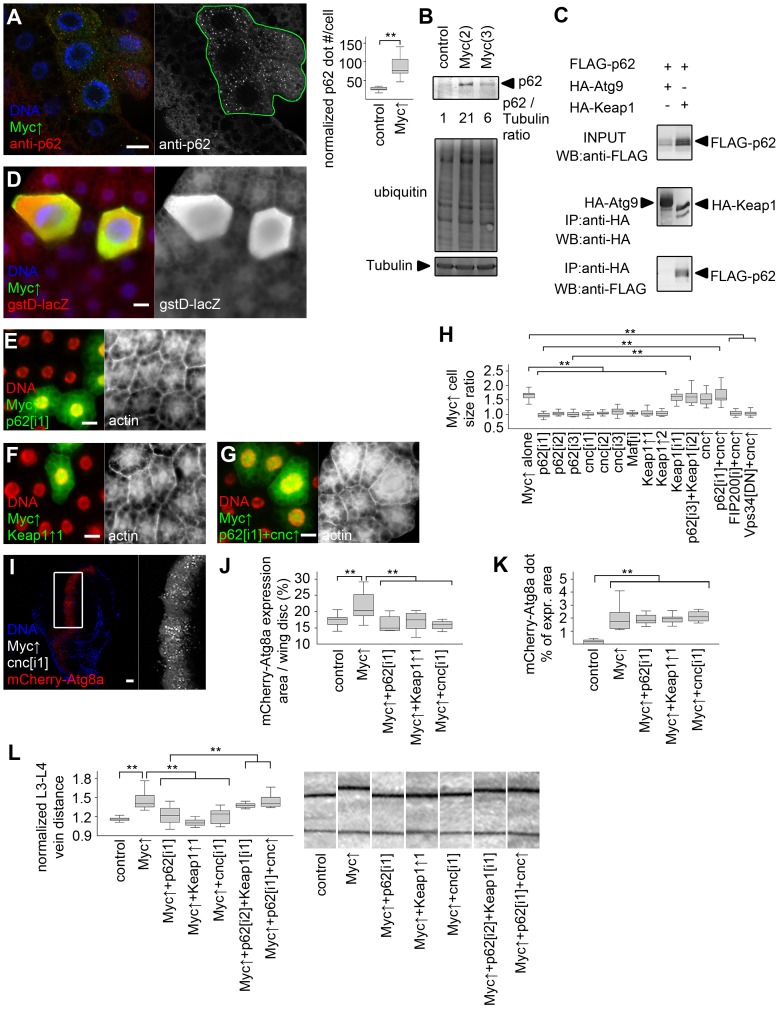
Figure 5. Activation of cnc/Nrf2 is required for Myc-induced overgrowth.
(A) p62 aggregates accumulate in Myc-expressing cells (marked by LAMP1-GFP) relative to neighboring control cells, n = 7 for both genotypes. (B) Overexpression of Myc upregulates p62 and increases ubiquitinated protein profiles in fat bodies of well-fed larvae. Numbers indicate the level of p62 relative to Tubulin in different genotypes, as determined by densitometry. (C) HA-Keap1 strongly binds to FLAG-tagged Drosophila p62 in immunoprecipitation (IP) experiments in cultured cells, unlike HA-Atg9. WB, western blot. (D) Myc overexpression in GFP-positive cells activates the Nrf2/cnc-dependent transcriptional reporter gstD-LacZ. (E, F) Depletion of p62 (E) or overexpression of Keap1 (F) inhibits Myc-induced overgrowth of GFP-positive cells relative to neighboring control cells. (G) Co-overexpression of cnc restores Myc-induced overgrowth of GFP-positive p62 RNAi cells compared to surrounding cells. (H) Knockdown of p62, cnc, Maf, or overexpression of Keap1 prevents Myc-induced overgrowth relative to neighboring control cells. Co-overexpression of cnc or Keap1 depletion has little effect on Myc-expressing cell size. Depletion of Keap1 restores Myc-induced overgrowth in p62 RNAi cells, similar to overexpression of cnc. Myc-induced overgrowth is not restored by cnc overexpression in FIP200 RNAi or dominant-negative Vps34 expressing cells. n = 8–11 per genotype. (I–K) Knockdown of cnc (I), p62 or overexpression of Keap1 prevents Myc-induced increases in mCherry-Atg8a expression area of wing discs (quantifications shown in panel J; n = 10–25 per genotype) without affecting punctate mCherry-Atg8a labeling (K; n = 10–13 per genotype). (L) Myc overexpression in the patched domain increases L3–L4 vein distance, which is inhibited by knockdown of p62 or cnc, or by co-overexpression of Keap1. Keap1 depletion or cnc co-overexpression restores Myc-induced increased vein distance in p62 RNAi wings. n = 8–25 per genotype. Scalebars in A, E–G, I equal 20 µm, and 40 µm in D. Statistically significant differences are indicated, ** p<0.01.

