
Figure 4. Binding of MSA2-LysMAcmA and MSA2-LysMAcmD to L. lactis cells.
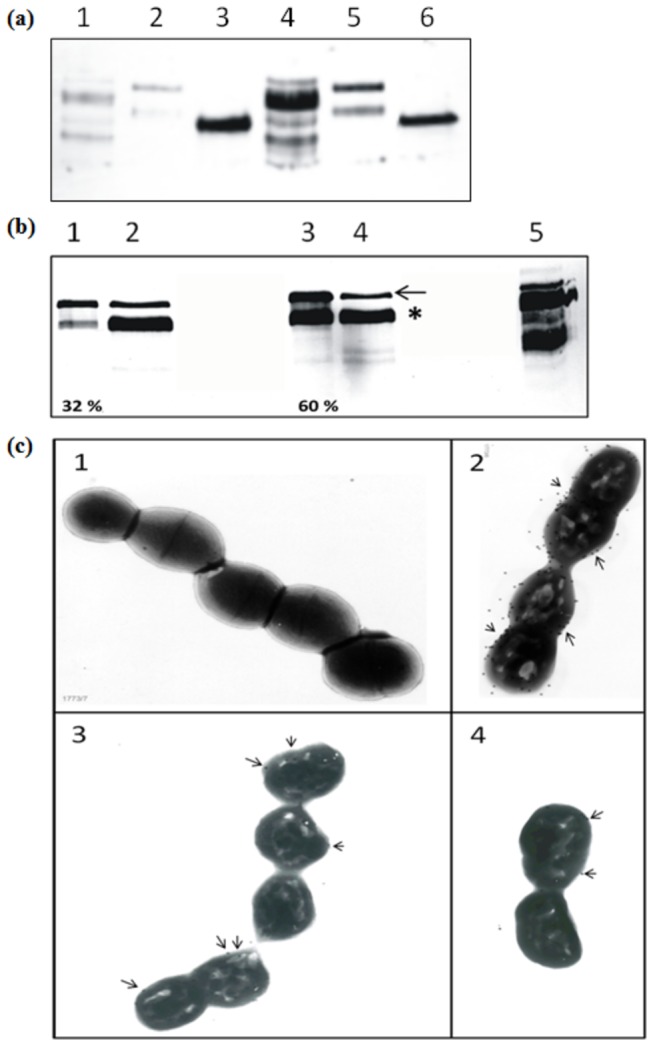
a. Anti-MSA2 antibody-treated Western blot showing binding of MSA2-LysMAcmA, MSA2-LysMAcmD and MSA2 to non-treated (lanes 1, 2 and 3) and TCA-treated (lanes 4, 5 and 6) L. lactis cells, respectively. b. Western blot treated with anti-MSA2 antibody. Lanes 1 and 3 indicate MSA2-LysMAcmD bound to TCA-treated L. lactis cells at pH 6.2 and 3.2, respectively. The unbound protein at pH 6.2 and 3.2 is shown in lanes 2 and 4, respectively. Lane 5, positive control: MSA2-LysMAcmA bound to L. lactis at pH 6.2. Arrow points out Pro-MSA2-LysMAcmD and * indicates mature MSA2-LysMAcmD. The percentage of both MSA2-LysM variants bound to L. lactis cells at pH 6.2 and 3.2 were semi-quantified (as the number of pixels present per mm2 of both bands in lanes 1 or 3) divided by the total signal of the cell and supernatant fractions (number of pixels per mm2 of all bands in lanes 1+2 or 3+4, respectively) is shown at the bottom of lanes 1 and 3. c. Transmission electron microscopic images of L. lactis incubated with MSA2 or MSA2 fusion proteins and subsequently incubated with rabbit anti-MSA2 antibodies and finally decorated with goat anti-rabbit IgG gold marker. Picture 1: non-treated L. lactis cells incubated with MSA2-LysMAcmA. Pictures 2, 3 and 4 show TCA-treated L. lactis cells incubated with MSA2-LysMAcmA, MSA2-LysMAcmD and MSA2 proteins, respectively. Arrows indicate immunogold particles detected on the cells.