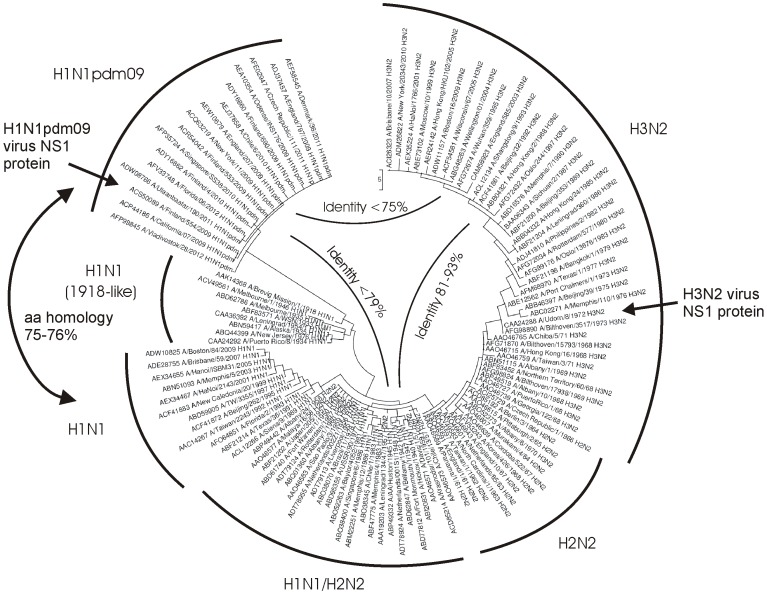
Figure 1. A phylogram of influenza A virus NS1 amino acid sequences from 113 human isolates representing strains circulating in human population from 1918 to 2012.
The phylogram was constructed by maximum parsimony method using MEGA 3.1 software. Branch lengths represent number of amino acid changes as indicated by the scale bar. GenBank accession number and the generic name of the virus subtype are shown. Viral NS1 sequences are grouped in different subtypes as indicated in the figure.

