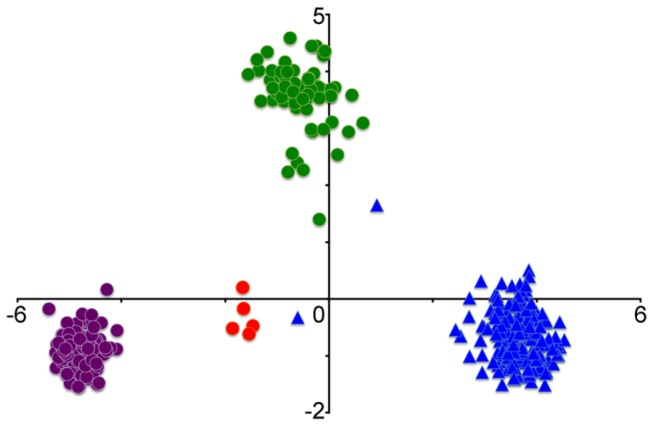
Figure 1. Graph of the first two axes from a PCA based on DArT marker variations.

The first component (x) accounts for 41.8% and the second (y) for 8.5% of the total variance. Circles denote Ae . tauschii TauL1 (purple), TauL2 (green), and TauL3 (red), and triangles T. aestivum.
