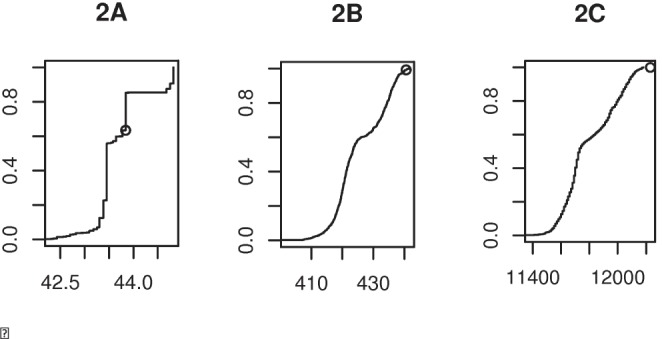
Figure 2. Cumulative frequency plots comparing the alignment score for the ancestral sequences (s(ax,ay), small circle) with the alignment scores of all pairs of proteins, s(i,j).

The example is the monocot/eudicot chloroplast dataset and for the short protein psbF (2A), a longer protein atpA (2B), and the 51 concatenated genes (2C). The x-axis shows the alignment score, which increases with the length of the protein(s), and is largest for the 51 concatenated proteins. There are 1056 s(i,j) scores between pairs of 24 monocots and 44 eudicots, and the y-axis indicates where the s(ax,ay) fits as a proportion of this number. For some short proteins in particular, multiple s(i,j) values equal the ancestral score s(ax,ay), and in this case our test conservatively places the ancestral score below the rest (as in psbF in Fig 2A).
