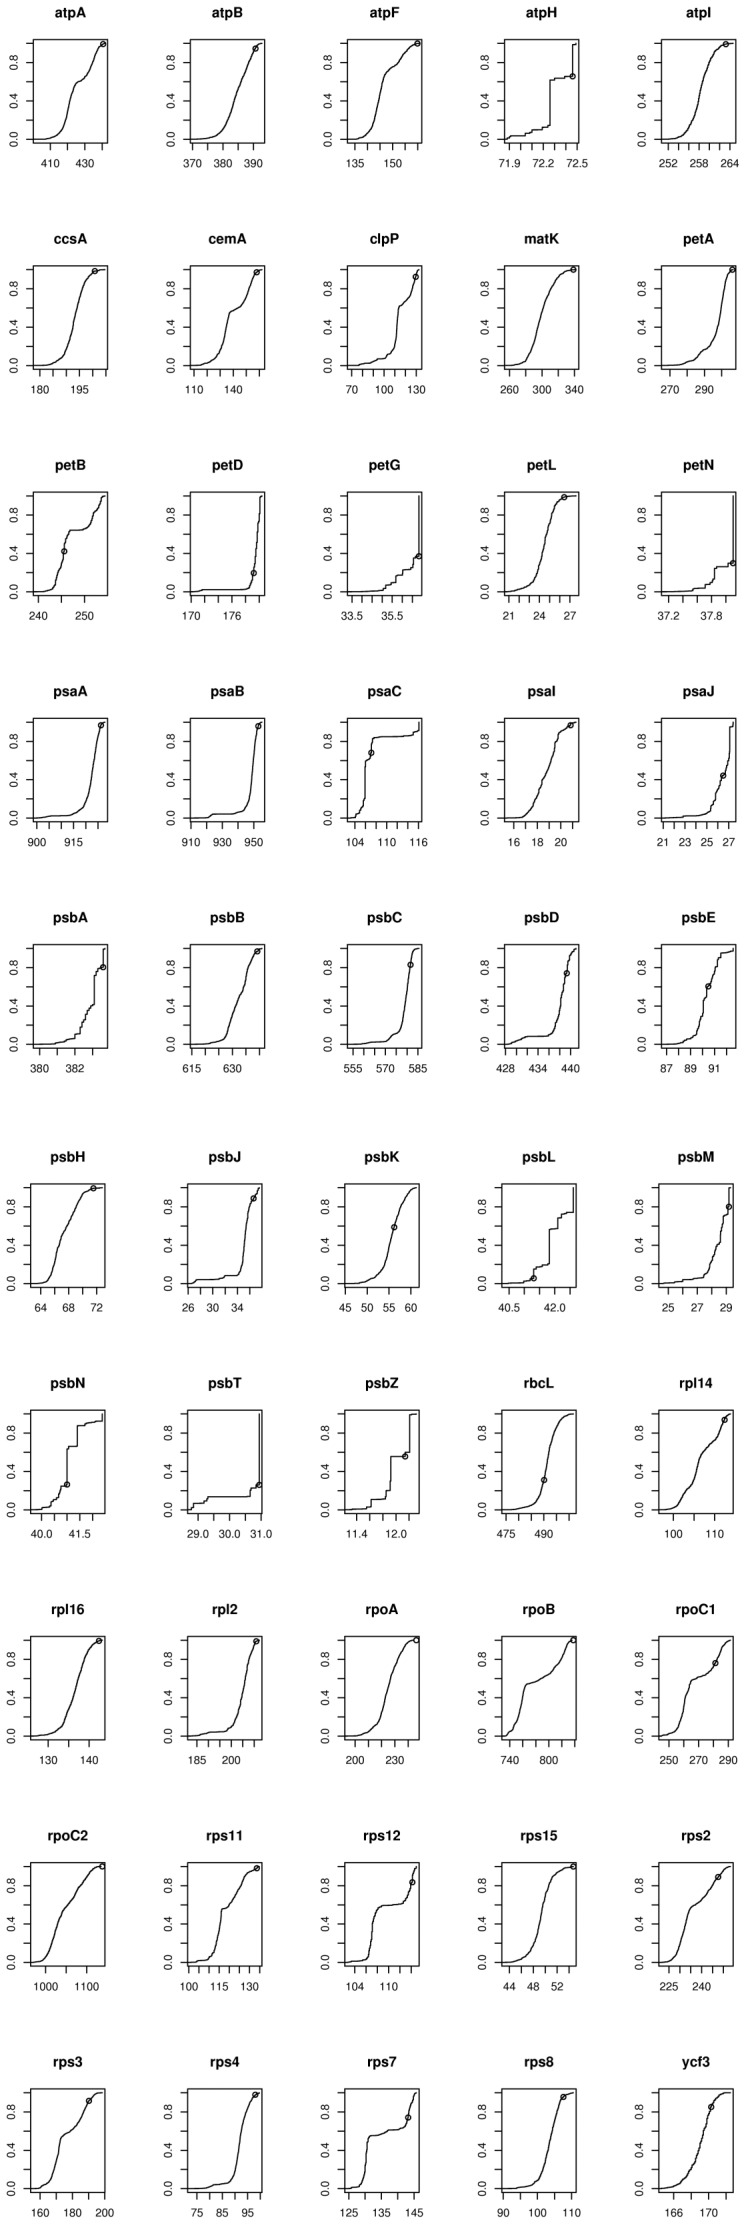
Figure 3. Cumulative distribution plots of the between-groups alignment scores for 50 of the 51 chloroplast proteins of monocots and eudicots (the plot for psbF is Fig 2A).
The ancestral alignment score (s(aX,aY)) is indicated by a small circle on each plot. There are 1056 comparisons (24 monocots×44 eudicots) for each protein. The y-axis is the same for each gene, but the x-axis is strongly dependent on the length of the protein (see also Figure 4).

